Salvadoran vs Immigrants from Kuwait Median Female Earnings
COMPARE
Salvadoran
Immigrants from Kuwait
Median Female Earnings
Median Female Earnings Comparison
Salvadorans
Immigrants from Kuwait
$37,083
MEDIAN FEMALE EARNINGS
0.4/ 100
METRIC RATING
264th/ 347
METRIC RANK
$41,055
MEDIAN FEMALE EARNINGS
94.4/ 100
METRIC RATING
120th/ 347
METRIC RANK
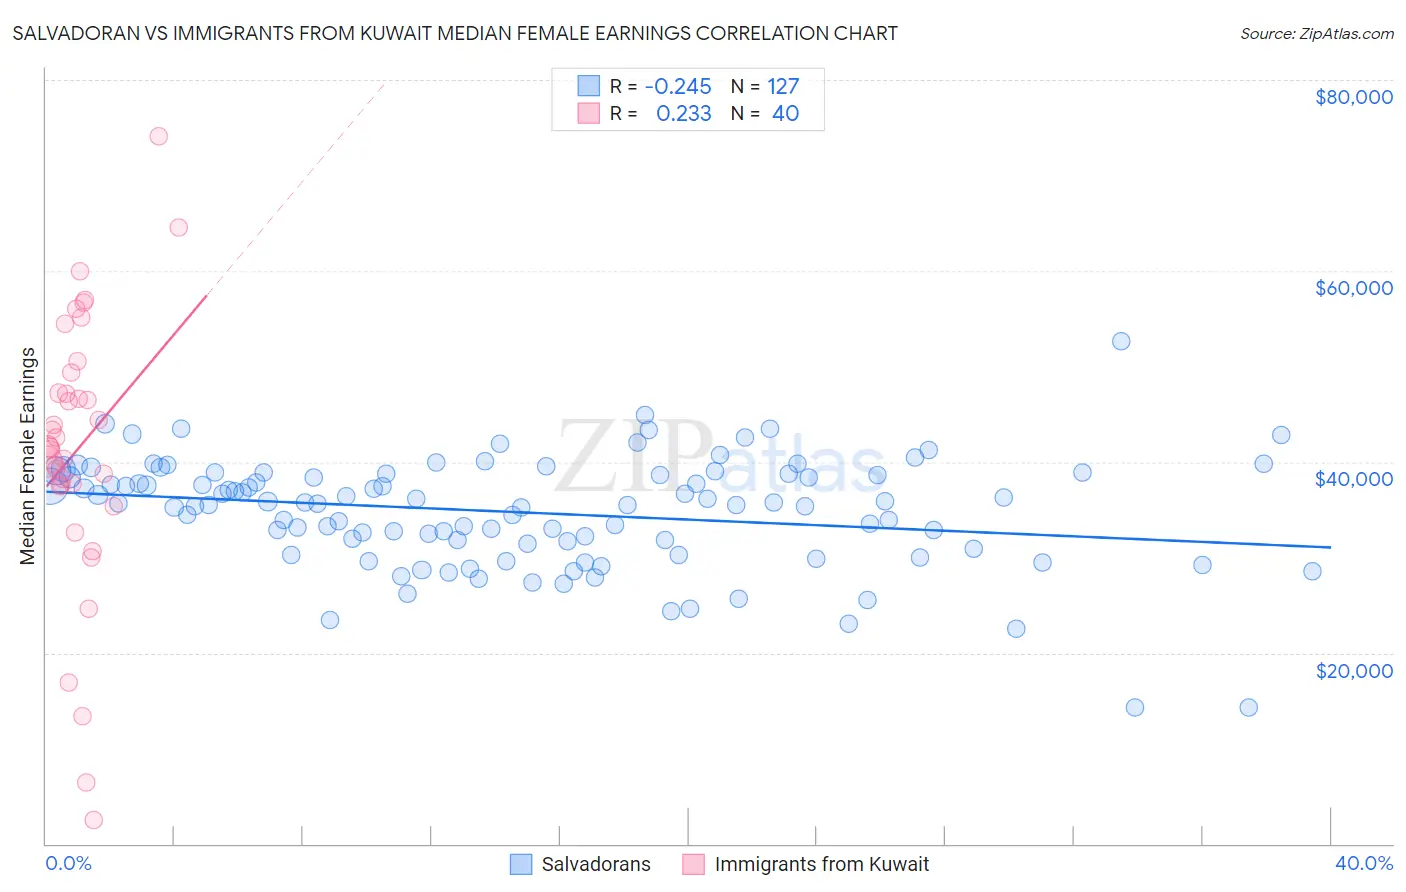
Salvadoran vs Immigrants from Kuwait Median Female Earnings Correlation Chart
The statistical analysis conducted on geographies consisting of 398,898,517 people shows a weak negative correlation between the proportion of Salvadorans and median female earnings in the United States with a correlation coefficient (R) of -0.245 and weighted average of $37,083. Similarly, the statistical analysis conducted on geographies consisting of 136,915,503 people shows a weak positive correlation between the proportion of Immigrants from Kuwait and median female earnings in the United States with a correlation coefficient (R) of 0.233 and weighted average of $41,055, a difference of 10.7%.
Median Female Earnings Correlation Summary
| Measurement | Salvadoran | Immigrants from Kuwait |
| Minimum | $14,245 | $2,499 |
| Maximum | $52,604 | $74,079 |
| Range | $38,359 | $71,580 |
| Mean | $34,711 | $41,287 |
| Median | $35,673 | $41,597 |
| Interquartile 25% (IQ1) | $31,372 | $37,555 |
| Interquartile 75% (IQ3) | $38,695 | $48,255 |
| Interquartile Range (IQR) | $7,323 | $10,700 |
| Standard Deviation (Sample) | $5,811 | $14,451 |
| Standard Deviation (Population) | $5,788 | $14,269 |
Similar Demographics by Median Female Earnings
Demographics Similar to Salvadorans by Median Female Earnings
In terms of median female earnings, the demographic groups most similar to Salvadorans are German Russian ($37,105, a difference of 0.060%), Immigrants from Belize ($37,056, a difference of 0.070%), Dominican ($37,046, a difference of 0.10%), Nonimmigrants ($37,024, a difference of 0.16%), and Cree ($37,018, a difference of 0.18%).
| Demographics | Rating | Rank | Median Female Earnings |
| Hawaiians | 1.0 /100 | #257 | Tragic $37,497 |
| Belizeans | 0.9 /100 | #258 | Tragic $37,429 |
| Scotch-Irish | 0.8 /100 | #259 | Tragic $37,383 |
| Dutch | 0.7 /100 | #260 | Tragic $37,339 |
| Malaysians | 0.7 /100 | #261 | Tragic $37,298 |
| Venezuelans | 0.7 /100 | #262 | Tragic $37,282 |
| German Russians | 0.5 /100 | #263 | Tragic $37,105 |
| Salvadorans | 0.4 /100 | #264 | Tragic $37,083 |
| Immigrants | Belize | 0.4 /100 | #265 | Tragic $37,056 |
| Dominicans | 0.4 /100 | #266 | Tragic $37,046 |
| Immigrants | Nonimmigrants | 0.4 /100 | #267 | Tragic $37,024 |
| Cree | 0.4 /100 | #268 | Tragic $37,018 |
| Immigrants | Venezuela | 0.4 /100 | #269 | Tragic $37,003 |
| French American Indians | 0.3 /100 | #270 | Tragic $36,920 |
| Nicaraguans | 0.3 /100 | #271 | Tragic $36,904 |
Demographics Similar to Immigrants from Kuwait by Median Female Earnings
In terms of median female earnings, the demographic groups most similar to Immigrants from Kuwait are Immigrants from Philippines ($41,114, a difference of 0.15%), Croatian ($40,993, a difference of 0.15%), Immigrants from Jordan ($40,977, a difference of 0.19%), Guyanese ($40,973, a difference of 0.20%), and Trinidadian and Tobagonian ($40,958, a difference of 0.24%).
| Demographics | Rating | Rank | Median Female Earnings |
| Macedonians | 96.4 /100 | #113 | Exceptional $41,286 |
| Immigrants | England | 96.4 /100 | #114 | Exceptional $41,277 |
| Koreans | 96.4 /100 | #115 | Exceptional $41,276 |
| Immigrants | Brazil | 96.4 /100 | #116 | Exceptional $41,273 |
| Barbadians | 96.3 /100 | #117 | Exceptional $41,261 |
| Immigrants | Lebanon | 95.6 /100 | #118 | Exceptional $41,183 |
| Immigrants | Philippines | 95.0 /100 | #119 | Exceptional $41,114 |
| Immigrants | Kuwait | 94.4 /100 | #120 | Exceptional $41,055 |
| Croatians | 93.7 /100 | #121 | Exceptional $40,993 |
| Immigrants | Jordan | 93.5 /100 | #122 | Exceptional $40,977 |
| Guyanese | 93.4 /100 | #123 | Exceptional $40,973 |
| Trinidadians and Tobagonians | 93.2 /100 | #124 | Exceptional $40,958 |
| Austrians | 92.7 /100 | #125 | Exceptional $40,923 |
| Immigrants | Trinidad and Tobago | 92.3 /100 | #126 | Exceptional $40,895 |
| Ugandans | 92.2 /100 | #127 | Exceptional $40,889 |