Nepalese vs Ethiopian Single Father Households
COMPARE
Nepalese
Ethiopian
Single Father Households
Single Father Households Comparison
Nepalese
Ethiopians
3.1%
SINGLE FATHER HOUSEHOLDS
0.0/ 100
METRIC RATING
330th/ 347
METRIC RANK
2.4%
SINGLE FATHER HOUSEHOLDS
16.6/ 100
METRIC RATING
214th/ 347
METRIC RANK
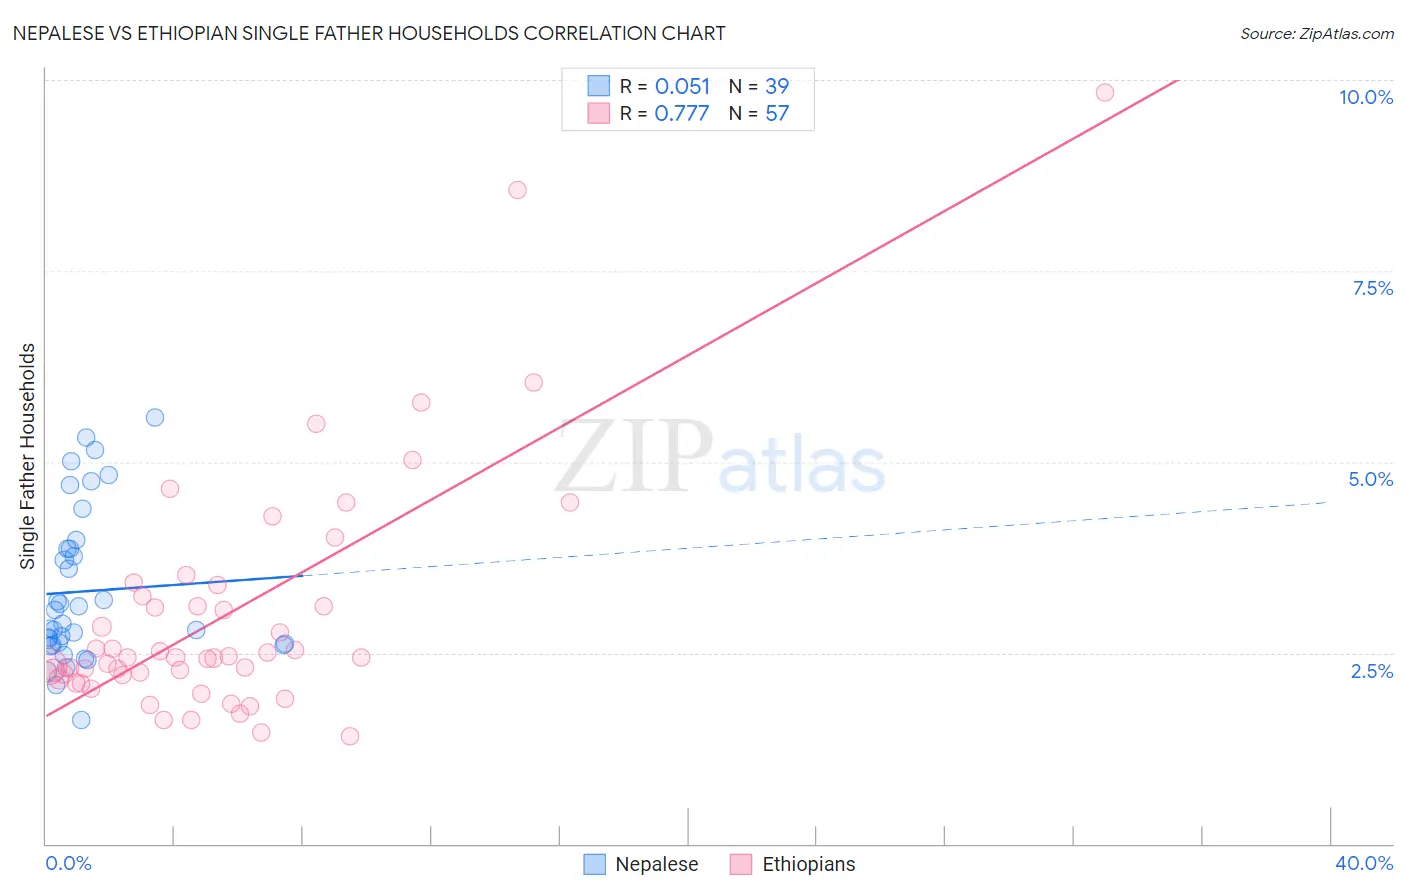
Nepalese vs Ethiopian Single Father Households Correlation Chart
The statistical analysis conducted on geographies consisting of 24,491,034 people shows a slight positive correlation between the proportion of Nepalese and percentage of single father households in the United States with a correlation coefficient (R) of 0.051 and weighted average of 3.1%. Similarly, the statistical analysis conducted on geographies consisting of 222,457,942 people shows a strong positive correlation between the proportion of Ethiopians and percentage of single father households in the United States with a correlation coefficient (R) of 0.777 and weighted average of 2.4%, a difference of 29.5%.
Single Father Households Correlation Summary
| Measurement | Nepalese | Ethiopian |
| Minimum | 1.6% | 1.4% |
| Maximum | 5.6% | 9.8% |
| Range | 4.0% | 8.4% |
| Mean | 3.3% | 3.0% |
| Median | 2.9% | 2.4% |
| Interquartile 25% (IQ1) | 2.6% | 2.2% |
| Interquartile 75% (IQ3) | 3.9% | 3.3% |
| Interquartile Range (IQR) | 1.3% | 1.1% |
| Standard Deviation (Sample) | 1.0% | 1.6% |
| Standard Deviation (Population) | 0.99% | 1.6% |
Similar Demographics by Single Father Households
Demographics Similar to Nepalese by Single Father Households
In terms of single father households, the demographic groups most similar to Nepalese are Chippewa (3.1%, a difference of 0.88%), Immigrants from Cabo Verde (3.1%, a difference of 0.98%), Bangladeshi (3.1%, a difference of 1.5%), Navajo (3.2%, a difference of 2.3%), and Yaqui (3.2%, a difference of 2.3%).
| Demographics | Rating | Rank | Single Father Households |
| Immigrants | Central America | 0.0 /100 | #323 | Tragic 3.0% |
| Fijians | 0.0 /100 | #324 | Tragic 3.0% |
| Immigrants | Mexico | 0.0 /100 | #325 | Tragic 3.0% |
| Aleuts | 0.0 /100 | #326 | Tragic 3.0% |
| Bangladeshis | 0.0 /100 | #327 | Tragic 3.1% |
| Immigrants | Cabo Verde | 0.0 /100 | #328 | Tragic 3.1% |
| Chippewa | 0.0 /100 | #329 | Tragic 3.1% |
| Nepalese | 0.0 /100 | #330 | Tragic 3.1% |
| Navajo | 0.0 /100 | #331 | Tragic 3.2% |
| Yaqui | 0.0 /100 | #332 | Tragic 3.2% |
| Natives/Alaskans | 0.0 /100 | #333 | Tragic 3.2% |
| Yuman | 0.0 /100 | #334 | Tragic 3.3% |
| Colville | 0.0 /100 | #335 | Tragic 3.3% |
| Paiute | 0.0 /100 | #336 | Tragic 3.3% |
| Pueblo | 0.0 /100 | #337 | Tragic 3.3% |
Demographics Similar to Ethiopians by Single Father Households
In terms of single father households, the demographic groups most similar to Ethiopians are Norwegian (2.4%, a difference of 0.060%), Immigrants from South Eastern Asia (2.4%, a difference of 0.090%), Finnish (2.4%, a difference of 0.21%), Immigrants from Ecuador (2.4%, a difference of 0.23%), and Immigrants from Nigeria (2.4%, a difference of 0.26%).
| Demographics | Rating | Rank | Single Father Households |
| Whites/Caucasians | 22.6 /100 | #207 | Fair 2.4% |
| Immigrants | Kenya | 20.3 /100 | #208 | Fair 2.4% |
| Immigrants | Peru | 19.3 /100 | #209 | Poor 2.4% |
| Immigrants | Costa Rica | 19.2 /100 | #210 | Poor 2.4% |
| Immigrants | Nigeria | 18.7 /100 | #211 | Poor 2.4% |
| Finns | 18.3 /100 | #212 | Poor 2.4% |
| Norwegians | 17.1 /100 | #213 | Poor 2.4% |
| Ethiopians | 16.6 /100 | #214 | Poor 2.4% |
| Immigrants | South Eastern Asia | 15.9 /100 | #215 | Poor 2.4% |
| Immigrants | Ecuador | 14.9 /100 | #216 | Poor 2.4% |
| Dutch | 14.3 /100 | #217 | Poor 2.4% |
| Immigrants | Ethiopia | 13.4 /100 | #218 | Poor 2.4% |
| Sudanese | 13.0 /100 | #219 | Poor 2.4% |
| Ghanaians | 12.9 /100 | #220 | Poor 2.4% |
| Immigrants | Burma/Myanmar | 12.1 /100 | #221 | Poor 2.4% |