Immigrants from Lebanon vs Burmese Wage/Income Gap
COMPARE
Immigrants from Lebanon
Burmese
Wage/Income Gap
Wage/Income Gap Comparison
Immigrants from Lebanon
Burmese
27.5%
WAGE/INCOME GAP
1.5/ 100
METRIC RATING
262nd/ 347
METRIC RANK
28.0%
WAGE/INCOME GAP
0.5/ 100
METRIC RATING
281st/ 347
METRIC RANK
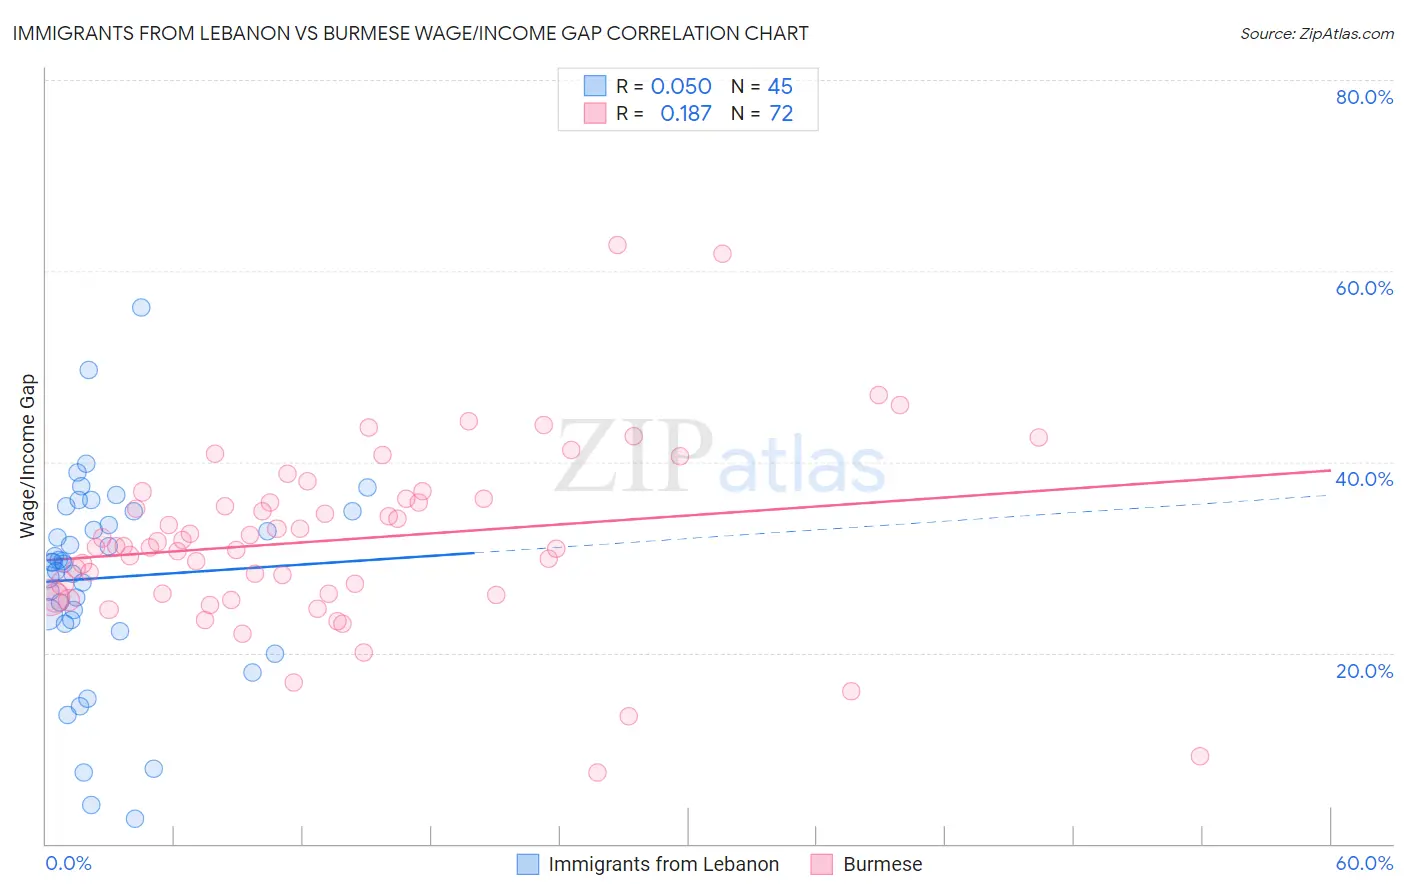
Immigrants from Lebanon vs Burmese Wage/Income Gap Correlation Chart
The statistical analysis conducted on geographies consisting of 217,102,915 people shows a slight positive correlation between the proportion of Immigrants from Lebanon and wage/income gap percentage in the United States with a correlation coefficient (R) of 0.050 and weighted average of 27.5%. Similarly, the statistical analysis conducted on geographies consisting of 464,918,136 people shows a poor positive correlation between the proportion of Burmese and wage/income gap percentage in the United States with a correlation coefficient (R) of 0.187 and weighted average of 28.0%, a difference of 1.7%.
Wage/Income Gap Correlation Summary
| Measurement | Immigrants from Lebanon | Burmese |
| Minimum | 2.7% | 7.4% |
| Maximum | 56.2% | 62.7% |
| Range | 53.5% | 55.3% |
| Mean | 27.9% | 31.9% |
| Median | 29.5% | 31.2% |
| Interquartile 25% (IQ1) | 23.2% | 26.1% |
| Interquartile 75% (IQ3) | 34.8% | 36.1% |
| Interquartile Range (IQR) | 11.6% | 10.0% |
| Standard Deviation (Sample) | 10.7% | 9.5% |
| Standard Deviation (Population) | 10.6% | 9.5% |
Demographics Similar to Immigrants from Lebanon and Burmese by Wage/Income Gap
In terms of wage/income gap, the demographic groups most similar to Immigrants from Lebanon are Immigrants from Germany (27.5%, a difference of 0.010%), Syrian (27.6%, a difference of 0.090%), Immigrants from Switzerland (27.7%, a difference of 0.55%), Serbian (27.7%, a difference of 0.55%), and Hmong (27.7%, a difference of 0.55%). Similarly, the demographic groups most similar to Burmese are Russian (28.0%, a difference of 0.050%), Romanian (28.0%, a difference of 0.20%), Immigrants from England (27.9%, a difference of 0.43%), Lebanese (27.9%, a difference of 0.51%), and Latvian (27.9%, a difference of 0.51%).
| Demographics | Rating | Rank | Wage/Income Gap |
| Immigrants | Germany | 1.5 /100 | #261 | Tragic 27.5% |
| Immigrants | Lebanon | 1.5 /100 | #262 | Tragic 27.5% |
| Syrians | 1.4 /100 | #263 | Tragic 27.6% |
| Immigrants | Switzerland | 1.0 /100 | #264 | Tragic 27.7% |
| Serbians | 1.0 /100 | #265 | Tragic 27.7% |
| Hmong | 1.0 /100 | #266 | Tragic 27.7% |
| Turks | 1.0 /100 | #267 | Tragic 27.7% |
| New Zealanders | 1.0 /100 | #268 | Tragic 27.7% |
| Potawatomi | 0.9 /100 | #269 | Tragic 27.7% |
| Immigrants | Western Europe | 0.9 /100 | #270 | Tragic 27.8% |
| Ute | 0.8 /100 | #271 | Tragic 27.8% |
| Immigrants | Korea | 0.8 /100 | #272 | Tragic 27.8% |
| Bulgarians | 0.7 /100 | #273 | Tragic 27.8% |
| Americans | 0.7 /100 | #274 | Tragic 27.8% |
| Immigrants | Japan | 0.7 /100 | #275 | Tragic 27.9% |
| Lebanese | 0.7 /100 | #276 | Tragic 27.9% |
| Latvians | 0.7 /100 | #277 | Tragic 27.9% |
| Immigrants | England | 0.6 /100 | #278 | Tragic 27.9% |
| Romanians | 0.5 /100 | #279 | Tragic 28.0% |
| Russians | 0.5 /100 | #280 | Tragic 28.0% |
| Burmese | 0.5 /100 | #281 | Tragic 28.0% |