Native Hawaiian vs U.S. Virgin Islander In Labor Force | Age 25-29
COMPARE
Native Hawaiian
U.S. Virgin Islander
In Labor Force | Age 25-29
In Labor Force | Age 25-29 Comparison
Native Hawaiians
U.S. Virgin Islanders
82.9%
IN LABOR FORCE | AGE 25-29
0.0/ 100
METRIC RATING
298th/ 347
METRIC RANK
83.8%
IN LABOR FORCE | AGE 25-29
0.6/ 100
METRIC RATING
242nd/ 347
METRIC RANK
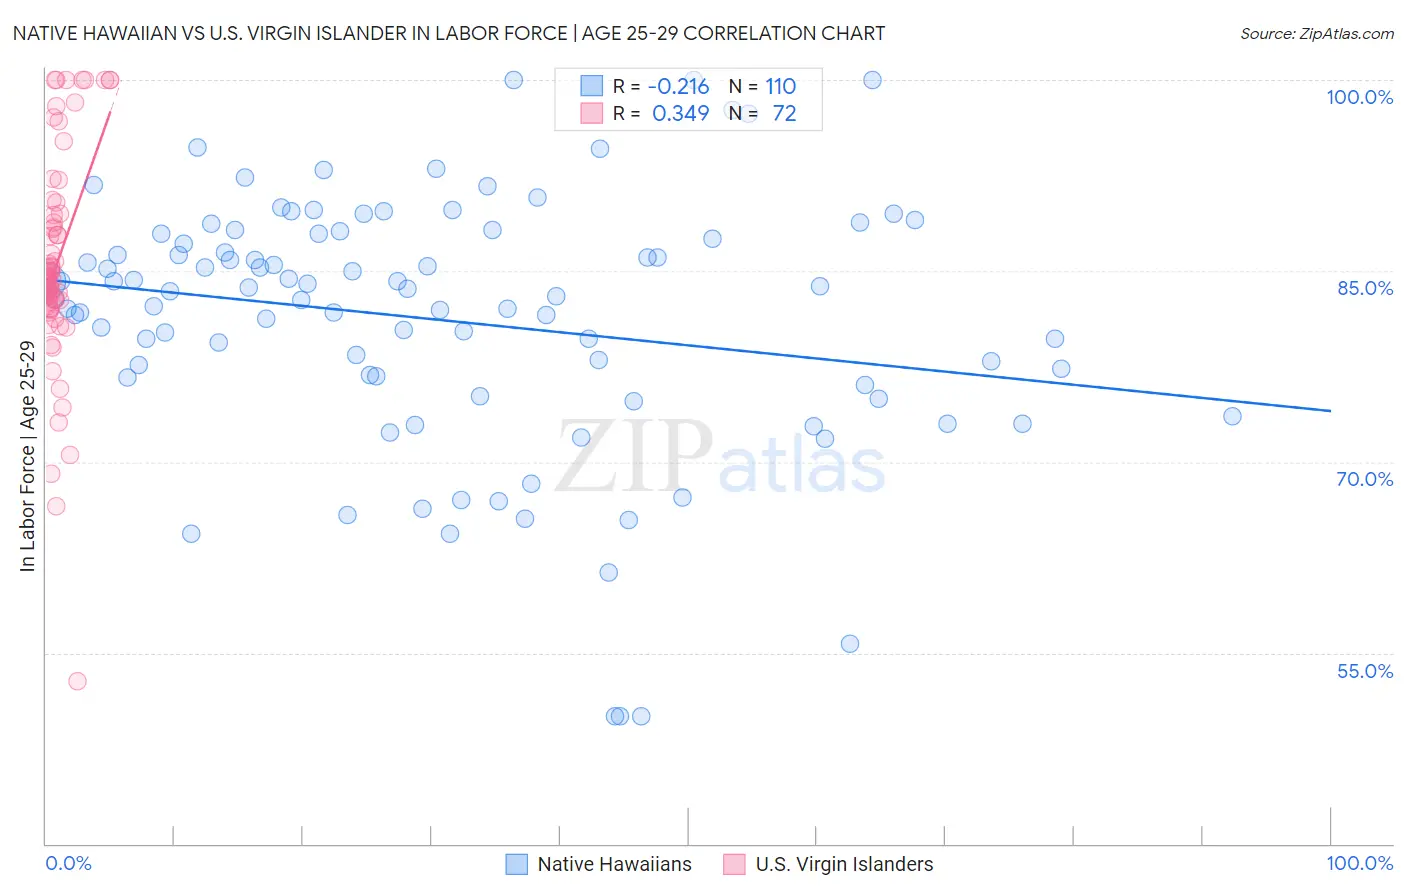
Native Hawaiian vs U.S. Virgin Islander In Labor Force | Age 25-29 Correlation Chart
The statistical analysis conducted on geographies consisting of 332,007,245 people shows a weak negative correlation between the proportion of Native Hawaiians and labor force participation rate among population between the ages 25 and 29 in the United States with a correlation coefficient (R) of -0.216 and weighted average of 82.9%. Similarly, the statistical analysis conducted on geographies consisting of 87,522,048 people shows a mild positive correlation between the proportion of U.S. Virgin Islanders and labor force participation rate among population between the ages 25 and 29 in the United States with a correlation coefficient (R) of 0.349 and weighted average of 83.8%, a difference of 1.1%.
In Labor Force | Age 25-29 Correlation Summary
| Measurement | Native Hawaiian | U.S. Virgin Islander |
| Minimum | 50.0% | 52.8% |
| Maximum | 100.0% | 100.0% |
| Range | 50.0% | 47.2% |
| Mean | 81.1% | 85.6% |
| Median | 83.2% | 84.5% |
| Interquartile 25% (IQ1) | 76.6% | 82.2% |
| Interquartile 75% (IQ3) | 87.9% | 89.4% |
| Interquartile Range (IQR) | 11.3% | 7.3% |
| Standard Deviation (Sample) | 10.1% | 8.6% |
| Standard Deviation (Population) | 10.1% | 8.5% |
Similar Demographics by In Labor Force | Age 25-29
Demographics Similar to Native Hawaiians by In Labor Force | Age 25-29
In terms of in labor force | age 25-29, the demographic groups most similar to Native Hawaiians are Immigrants from Nicaragua (82.9%, a difference of 0.010%), Potawatomi (82.9%, a difference of 0.010%), Fijian (82.9%, a difference of 0.010%), Immigrants from Latin America (82.9%, a difference of 0.020%), and Nepalese (82.9%, a difference of 0.020%).
| Demographics | Rating | Rank | In Labor Force | Age 25-29 |
| Hawaiians | 0.0 /100 | #291 | Tragic 83.0% |
| Immigrants | Guyana | 0.0 /100 | #292 | Tragic 83.0% |
| Immigrants | Latin America | 0.0 /100 | #293 | Tragic 82.9% |
| Nepalese | 0.0 /100 | #294 | Tragic 82.9% |
| Chippewa | 0.0 /100 | #295 | Tragic 82.9% |
| Immigrants | Nicaragua | 0.0 /100 | #296 | Tragic 82.9% |
| Potawatomi | 0.0 /100 | #297 | Tragic 82.9% |
| Native Hawaiians | 0.0 /100 | #298 | Tragic 82.9% |
| Fijians | 0.0 /100 | #299 | Tragic 82.9% |
| Spanish American Indians | 0.0 /100 | #300 | Tragic 82.9% |
| Vietnamese | 0.0 /100 | #301 | Tragic 82.8% |
| Immigrants | Belize | 0.0 /100 | #302 | Tragic 82.8% |
| Immigrants | Grenada | 0.0 /100 | #303 | Tragic 82.8% |
| Immigrants | St. Vincent and the Grenadines | 0.0 /100 | #304 | Tragic 82.7% |
| Blacks/African Americans | 0.0 /100 | #305 | Tragic 82.6% |
Demographics Similar to U.S. Virgin Islanders by In Labor Force | Age 25-29
In terms of in labor force | age 25-29, the demographic groups most similar to U.S. Virgin Islanders are Salvadoran (83.8%, a difference of 0.010%), Alsatian (83.9%, a difference of 0.030%), Immigrants from Jamaica (83.8%, a difference of 0.050%), Iroquois (83.8%, a difference of 0.050%), and Immigrants from Uzbekistan (83.9%, a difference of 0.060%).
| Demographics | Rating | Rank | In Labor Force | Age 25-29 |
| Iraqis | 0.9 /100 | #235 | Tragic 83.9% |
| Guamanians/Chamorros | 0.9 /100 | #236 | Tragic 83.9% |
| Immigrants | Immigrants | 0.9 /100 | #237 | Tragic 83.9% |
| Immigrants | Uzbekistan | 0.8 /100 | #238 | Tragic 83.9% |
| Jamaicans | 0.8 /100 | #239 | Tragic 83.9% |
| Trinidadians and Tobagonians | 0.7 /100 | #240 | Tragic 83.9% |
| Alsatians | 0.7 /100 | #241 | Tragic 83.9% |
| U.S. Virgin Islanders | 0.6 /100 | #242 | Tragic 83.8% |
| Salvadorans | 0.5 /100 | #243 | Tragic 83.8% |
| Immigrants | Jamaica | 0.4 /100 | #244 | Tragic 83.8% |
| Iroquois | 0.4 /100 | #245 | Tragic 83.8% |
| Cree | 0.3 /100 | #246 | Tragic 83.8% |
| Immigrants | El Salvador | 0.3 /100 | #247 | Tragic 83.7% |
| Immigrants | Nonimmigrants | 0.3 /100 | #248 | Tragic 83.7% |
| Hmong | 0.3 /100 | #249 | Tragic 83.7% |