Mongolian vs U.S. Virgin Islander Median Earnings
COMPARE
Mongolian
U.S. Virgin Islander
Median Earnings
Median Earnings Comparison
Mongolians
U.S. Virgin Islanders
$51,038
MEDIAN EARNINGS
99.8/ 100
METRIC RATING
69th/ 347
METRIC RANK
$41,448
MEDIAN EARNINGS
0.1/ 100
METRIC RATING
292nd/ 347
METRIC RANK
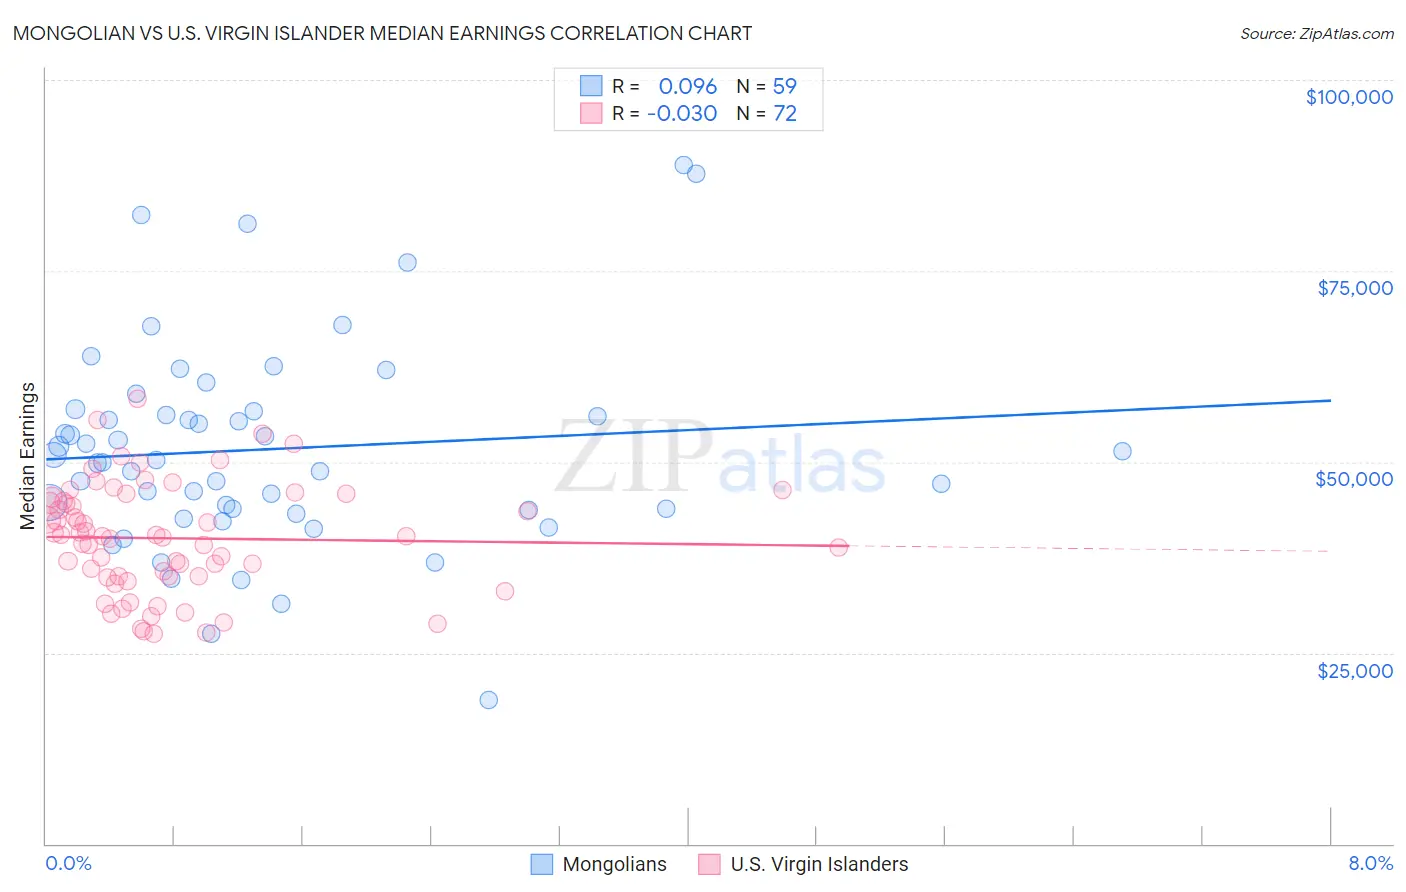
Mongolian vs U.S. Virgin Islander Median Earnings Correlation Chart
The statistical analysis conducted on geographies consisting of 140,341,954 people shows a slight positive correlation between the proportion of Mongolians and median earnings in the United States with a correlation coefficient (R) of 0.096 and weighted average of $51,038. Similarly, the statistical analysis conducted on geographies consisting of 87,526,165 people shows no correlation between the proportion of U.S. Virgin Islanders and median earnings in the United States with a correlation coefficient (R) of -0.030 and weighted average of $41,448, a difference of 23.1%.
Median Earnings Correlation Summary
| Measurement | Mongolian | U.S. Virgin Islander |
| Minimum | $18,750 | $27,466 |
| Maximum | $88,819 | $58,251 |
| Range | $70,069 | $30,785 |
| Mean | $51,652 | $39,999 |
| Median | $50,317 | $40,206 |
| Interquartile 25% (IQ1) | $43,750 | $35,022 |
| Interquartile 75% (IQ3) | $56,610 | $45,141 |
| Interquartile Range (IQR) | $12,860 | $10,119 |
| Standard Deviation (Sample) | $13,573 | $7,165 |
| Standard Deviation (Population) | $13,457 | $7,115 |
Similar Demographics by Median Earnings
Demographics Similar to Mongolians by Median Earnings
In terms of median earnings, the demographic groups most similar to Mongolians are Paraguayan ($51,068, a difference of 0.060%), Lithuanian ($50,991, a difference of 0.090%), Immigrants from Ukraine ($50,984, a difference of 0.10%), Immigrants from Spain ($51,092, a difference of 0.11%), and Afghan ($51,112, a difference of 0.15%).
| Demographics | Rating | Rank | Median Earnings |
| Immigrants | Romania | 99.9 /100 | #62 | Exceptional $51,337 |
| Immigrants | Bulgaria | 99.9 /100 | #63 | Exceptional $51,318 |
| New Zealanders | 99.9 /100 | #64 | Exceptional $51,246 |
| Greeks | 99.9 /100 | #65 | Exceptional $51,164 |
| Afghans | 99.9 /100 | #66 | Exceptional $51,112 |
| Immigrants | Spain | 99.9 /100 | #67 | Exceptional $51,092 |
| Paraguayans | 99.9 /100 | #68 | Exceptional $51,068 |
| Mongolians | 99.8 /100 | #69 | Exceptional $51,038 |
| Lithuanians | 99.8 /100 | #70 | Exceptional $50,991 |
| Immigrants | Ukraine | 99.8 /100 | #71 | Exceptional $50,984 |
| Immigrants | Egypt | 99.8 /100 | #72 | Exceptional $50,901 |
| Immigrants | Netherlands | 99.8 /100 | #73 | Exceptional $50,818 |
| South Africans | 99.8 /100 | #74 | Exceptional $50,752 |
| Immigrants | Scotland | 99.8 /100 | #75 | Exceptional $50,741 |
| Immigrants | Italy | 99.7 /100 | #76 | Exceptional $50,581 |
Demographics Similar to U.S. Virgin Islanders by Median Earnings
In terms of median earnings, the demographic groups most similar to U.S. Virgin Islanders are Central American Indian ($41,474, a difference of 0.060%), Paiute ($41,508, a difference of 0.15%), Comanche ($41,519, a difference of 0.17%), Immigrants from Dominican Republic ($41,554, a difference of 0.26%), and Immigrants from Zaire ($41,325, a difference of 0.30%).
| Demographics | Rating | Rank | Median Earnings |
| Immigrants | Nicaragua | 0.1 /100 | #285 | Tragic $41,737 |
| Mexican American Indians | 0.1 /100 | #286 | Tragic $41,719 |
| Indonesians | 0.1 /100 | #287 | Tragic $41,701 |
| Immigrants | Dominican Republic | 0.1 /100 | #288 | Tragic $41,554 |
| Comanche | 0.1 /100 | #289 | Tragic $41,519 |
| Paiute | 0.1 /100 | #290 | Tragic $41,508 |
| Central American Indians | 0.1 /100 | #291 | Tragic $41,474 |
| U.S. Virgin Islanders | 0.1 /100 | #292 | Tragic $41,448 |
| Immigrants | Zaire | 0.1 /100 | #293 | Tragic $41,325 |
| Potawatomi | 0.1 /100 | #294 | Tragic $41,288 |
| Bangladeshis | 0.1 /100 | #295 | Tragic $41,263 |
| Cherokee | 0.1 /100 | #296 | Tragic $41,252 |
| Guatemalans | 0.1 /100 | #297 | Tragic $41,205 |
| Immigrants | Micronesia | 0.1 /100 | #298 | Tragic $41,133 |
| Immigrants | Caribbean | 0.1 /100 | #299 | Tragic $41,119 |