Native Hawaiian vs U.S. Virgin Islander Median Male Earnings
COMPARE
Native Hawaiian
U.S. Virgin Islander
Median Male Earnings
Median Male Earnings Comparison
Native Hawaiians
U.S. Virgin Islanders
$52,306
MEDIAN MALE EARNINGS
10.5/ 100
METRIC RATING
213th/ 347
METRIC RANK
$47,066
MEDIAN MALE EARNINGS
0.1/ 100
METRIC RATING
300th/ 347
METRIC RANK
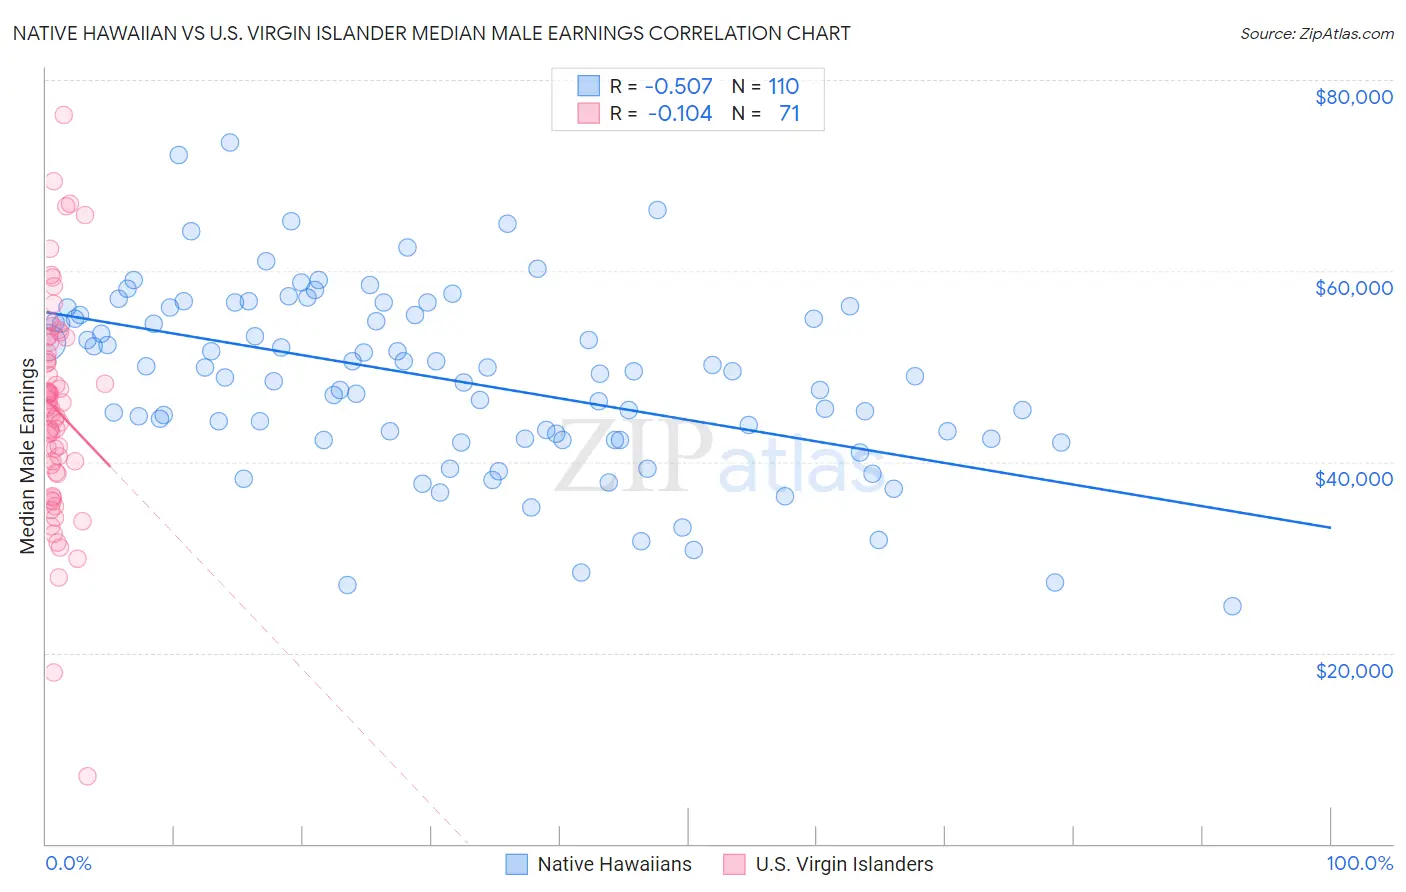
Native Hawaiian vs U.S. Virgin Islander Median Male Earnings Correlation Chart
The statistical analysis conducted on geographies consisting of 332,009,259 people shows a substantial negative correlation between the proportion of Native Hawaiians and median male earnings in the United States with a correlation coefficient (R) of -0.507 and weighted average of $52,306. Similarly, the statistical analysis conducted on geographies consisting of 87,522,677 people shows a poor negative correlation between the proportion of U.S. Virgin Islanders and median male earnings in the United States with a correlation coefficient (R) of -0.104 and weighted average of $47,066, a difference of 11.1%.
Median Male Earnings Correlation Summary
| Measurement | Native Hawaiian | U.S. Virgin Islander |
| Minimum | $24,830 | $7,097 |
| Maximum | $73,412 | $76,348 |
| Range | $48,582 | $69,251 |
| Mean | $48,621 | $45,487 |
| Median | $49,328 | $45,658 |
| Interquartile 25% (IQ1) | $42,387 | $38,902 |
| Interquartile 75% (IQ3) | $55,422 | $52,442 |
| Interquartile Range (IQR) | $13,035 | $13,540 |
| Standard Deviation (Sample) | $9,458 | $11,420 |
| Standard Deviation (Population) | $9,414 | $11,340 |
Similar Demographics by Median Male Earnings
Demographics Similar to Native Hawaiians by Median Male Earnings
In terms of median male earnings, the demographic groups most similar to Native Hawaiians are Cajun ($52,325, a difference of 0.040%), Delaware ($52,412, a difference of 0.20%), Tlingit-Haida ($52,409, a difference of 0.20%), Nonimmigrants ($52,170, a difference of 0.26%), and Bermudan ($52,465, a difference of 0.30%).
| Demographics | Rating | Rank | Median Male Earnings |
| Immigrants | Iraq | 14.5 /100 | #206 | Poor $52,681 |
| Vietnamese | 12.7 /100 | #207 | Poor $52,525 |
| Venezuelans | 12.5 /100 | #208 | Poor $52,510 |
| Bermudans | 12.1 /100 | #209 | Poor $52,465 |
| Delaware | 11.5 /100 | #210 | Poor $52,412 |
| Tlingit-Haida | 11.5 /100 | #211 | Poor $52,409 |
| Cajuns | 10.7 /100 | #212 | Poor $52,325 |
| Native Hawaiians | 10.5 /100 | #213 | Poor $52,306 |
| Immigrants | Nonimmigrants | 9.3 /100 | #214 | Tragic $52,170 |
| Immigrants | Cameroon | 8.9 /100 | #215 | Tragic $52,119 |
| Immigrants | Venezuela | 8.3 /100 | #216 | Tragic $52,041 |
| Nigerians | 8.3 /100 | #217 | Tragic $52,039 |
| Immigrants | Panama | 7.7 /100 | #218 | Tragic $51,962 |
| Immigrants | Ghana | 6.9 /100 | #219 | Tragic $51,836 |
| Immigrants | Armenia | 6.6 /100 | #220 | Tragic $51,793 |
Demographics Similar to U.S. Virgin Islanders by Median Male Earnings
In terms of median male earnings, the demographic groups most similar to U.S. Virgin Islanders are Immigrants from Zaire ($47,070, a difference of 0.010%), Immigrants from Micronesia ($47,177, a difference of 0.23%), Immigrants from Latin America ($46,941, a difference of 0.27%), Dominican ($47,204, a difference of 0.29%), and Inupiat ($47,281, a difference of 0.46%).
| Demographics | Rating | Rank | Median Male Earnings |
| Indonesians | 0.1 /100 | #293 | Tragic $47,503 |
| Immigrants | Nicaragua | 0.1 /100 | #294 | Tragic $47,482 |
| Central American Indians | 0.1 /100 | #295 | Tragic $47,433 |
| Inupiat | 0.1 /100 | #296 | Tragic $47,281 |
| Dominicans | 0.1 /100 | #297 | Tragic $47,204 |
| Immigrants | Micronesia | 0.1 /100 | #298 | Tragic $47,177 |
| Immigrants | Zaire | 0.1 /100 | #299 | Tragic $47,070 |
| U.S. Virgin Islanders | 0.1 /100 | #300 | Tragic $47,066 |
| Immigrants | Latin America | 0.1 /100 | #301 | Tragic $46,941 |
| Seminole | 0.1 /100 | #302 | Tragic $46,783 |
| Yaqui | 0.1 /100 | #303 | Tragic $46,777 |
| Bangladeshis | 0.1 /100 | #304 | Tragic $46,744 |
| Guatemalans | 0.0 /100 | #305 | Tragic $46,736 |
| Dutch West Indians | 0.0 /100 | #306 | Tragic $46,656 |
| Immigrants | Dominican Republic | 0.0 /100 | #307 | Tragic $46,655 |