Moroccan vs U.S. Virgin Islander Median Earnings
COMPARE
Moroccan
U.S. Virgin Islander
Median Earnings
Median Earnings Comparison
Moroccans
U.S. Virgin Islanders
$48,838
MEDIAN EARNINGS
96.7/ 100
METRIC RATING
114th/ 347
METRIC RANK
$41,448
MEDIAN EARNINGS
0.1/ 100
METRIC RATING
292nd/ 347
METRIC RANK
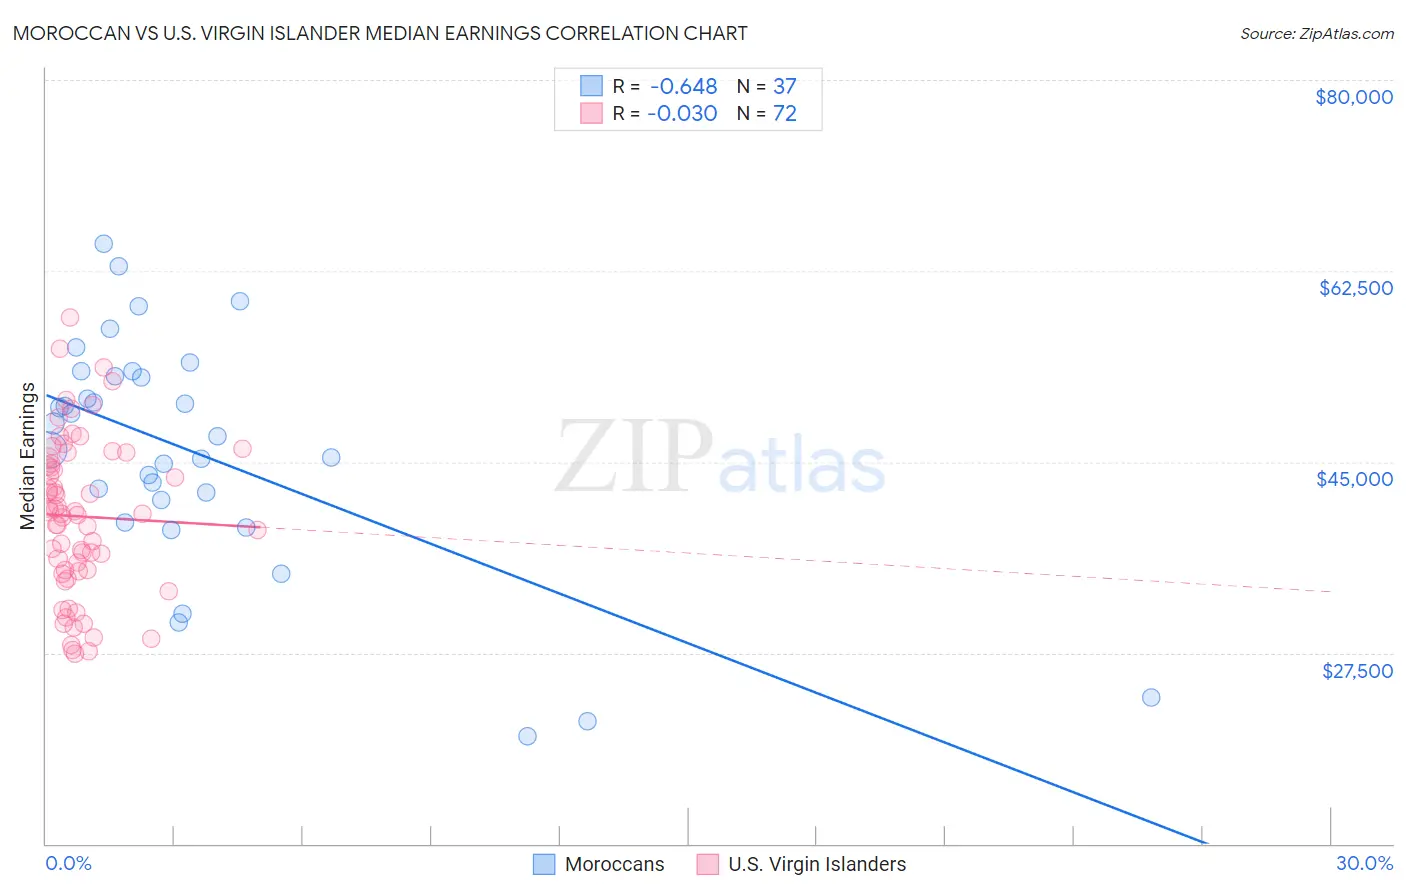
Moroccan vs U.S. Virgin Islander Median Earnings Correlation Chart
The statistical analysis conducted on geographies consisting of 201,800,770 people shows a significant negative correlation between the proportion of Moroccans and median earnings in the United States with a correlation coefficient (R) of -0.648 and weighted average of $48,838. Similarly, the statistical analysis conducted on geographies consisting of 87,526,165 people shows no correlation between the proportion of U.S. Virgin Islanders and median earnings in the United States with a correlation coefficient (R) of -0.030 and weighted average of $41,448, a difference of 17.8%.
Median Earnings Correlation Summary
| Measurement | Moroccan | U.S. Virgin Islander |
| Minimum | $19,886 | $27,466 |
| Maximum | $64,979 | $58,251 |
| Range | $45,093 | $30,785 |
| Mean | $45,820 | $39,999 |
| Median | $47,333 | $40,206 |
| Interquartile 25% (IQ1) | $40,473 | $35,022 |
| Interquartile 75% (IQ3) | $53,052 | $45,141 |
| Interquartile Range (IQR) | $12,578 | $10,119 |
| Standard Deviation (Sample) | $10,819 | $7,165 |
| Standard Deviation (Population) | $10,672 | $7,115 |
Similar Demographics by Median Earnings
Demographics Similar to Moroccans by Median Earnings
In terms of median earnings, the demographic groups most similar to Moroccans are Chinese ($48,836, a difference of 0.010%), Immigrants from Kuwait ($48,861, a difference of 0.050%), Northern European ($48,887, a difference of 0.10%), Immigrants from Zimbabwe ($48,913, a difference of 0.15%), and Immigrants from Ethiopia ($48,924, a difference of 0.17%).
| Demographics | Rating | Rank | Median Earnings |
| Immigrants | Morocco | 98.4 /100 | #107 | Exceptional $49,368 |
| Palestinians | 98.0 /100 | #108 | Exceptional $49,209 |
| Syrians | 97.1 /100 | #109 | Exceptional $48,934 |
| Immigrants | Ethiopia | 97.1 /100 | #110 | Exceptional $48,924 |
| Immigrants | Zimbabwe | 97.0 /100 | #111 | Exceptional $48,913 |
| Northern Europeans | 96.9 /100 | #112 | Exceptional $48,887 |
| Immigrants | Kuwait | 96.8 /100 | #113 | Exceptional $48,861 |
| Moroccans | 96.7 /100 | #114 | Exceptional $48,838 |
| Chinese | 96.7 /100 | #115 | Exceptional $48,836 |
| Koreans | 96.2 /100 | #116 | Exceptional $48,727 |
| Serbians | 95.9 /100 | #117 | Exceptional $48,677 |
| Immigrants | Jordan | 95.9 /100 | #118 | Exceptional $48,673 |
| Poles | 95.8 /100 | #119 | Exceptional $48,659 |
| Carpatho Rusyns | 95.5 /100 | #120 | Exceptional $48,617 |
| Arabs | 95.4 /100 | #121 | Exceptional $48,599 |
Demographics Similar to U.S. Virgin Islanders by Median Earnings
In terms of median earnings, the demographic groups most similar to U.S. Virgin Islanders are Central American Indian ($41,474, a difference of 0.060%), Paiute ($41,508, a difference of 0.15%), Comanche ($41,519, a difference of 0.17%), Immigrants from Dominican Republic ($41,554, a difference of 0.26%), and Immigrants from Zaire ($41,325, a difference of 0.30%).
| Demographics | Rating | Rank | Median Earnings |
| Immigrants | Nicaragua | 0.1 /100 | #285 | Tragic $41,737 |
| Mexican American Indians | 0.1 /100 | #286 | Tragic $41,719 |
| Indonesians | 0.1 /100 | #287 | Tragic $41,701 |
| Immigrants | Dominican Republic | 0.1 /100 | #288 | Tragic $41,554 |
| Comanche | 0.1 /100 | #289 | Tragic $41,519 |
| Paiute | 0.1 /100 | #290 | Tragic $41,508 |
| Central American Indians | 0.1 /100 | #291 | Tragic $41,474 |
| U.S. Virgin Islanders | 0.1 /100 | #292 | Tragic $41,448 |
| Immigrants | Zaire | 0.1 /100 | #293 | Tragic $41,325 |
| Potawatomi | 0.1 /100 | #294 | Tragic $41,288 |
| Bangladeshis | 0.1 /100 | #295 | Tragic $41,263 |
| Cherokee | 0.1 /100 | #296 | Tragic $41,252 |
| Guatemalans | 0.1 /100 | #297 | Tragic $41,205 |
| Immigrants | Micronesia | 0.1 /100 | #298 | Tragic $41,133 |
| Immigrants | Caribbean | 0.1 /100 | #299 | Tragic $41,119 |