Malaysian vs Immigrants from Hungary Median Female Earnings
COMPARE
Malaysian
Immigrants from Hungary
Median Female Earnings
Median Female Earnings Comparison
Malaysians
Immigrants from Hungary
$37,298
MEDIAN FEMALE EARNINGS
0.7/ 100
METRIC RATING
261st/ 347
METRIC RANK
$41,820
MEDIAN FEMALE EARNINGS
98.8/ 100
METRIC RATING
97th/ 347
METRIC RANK
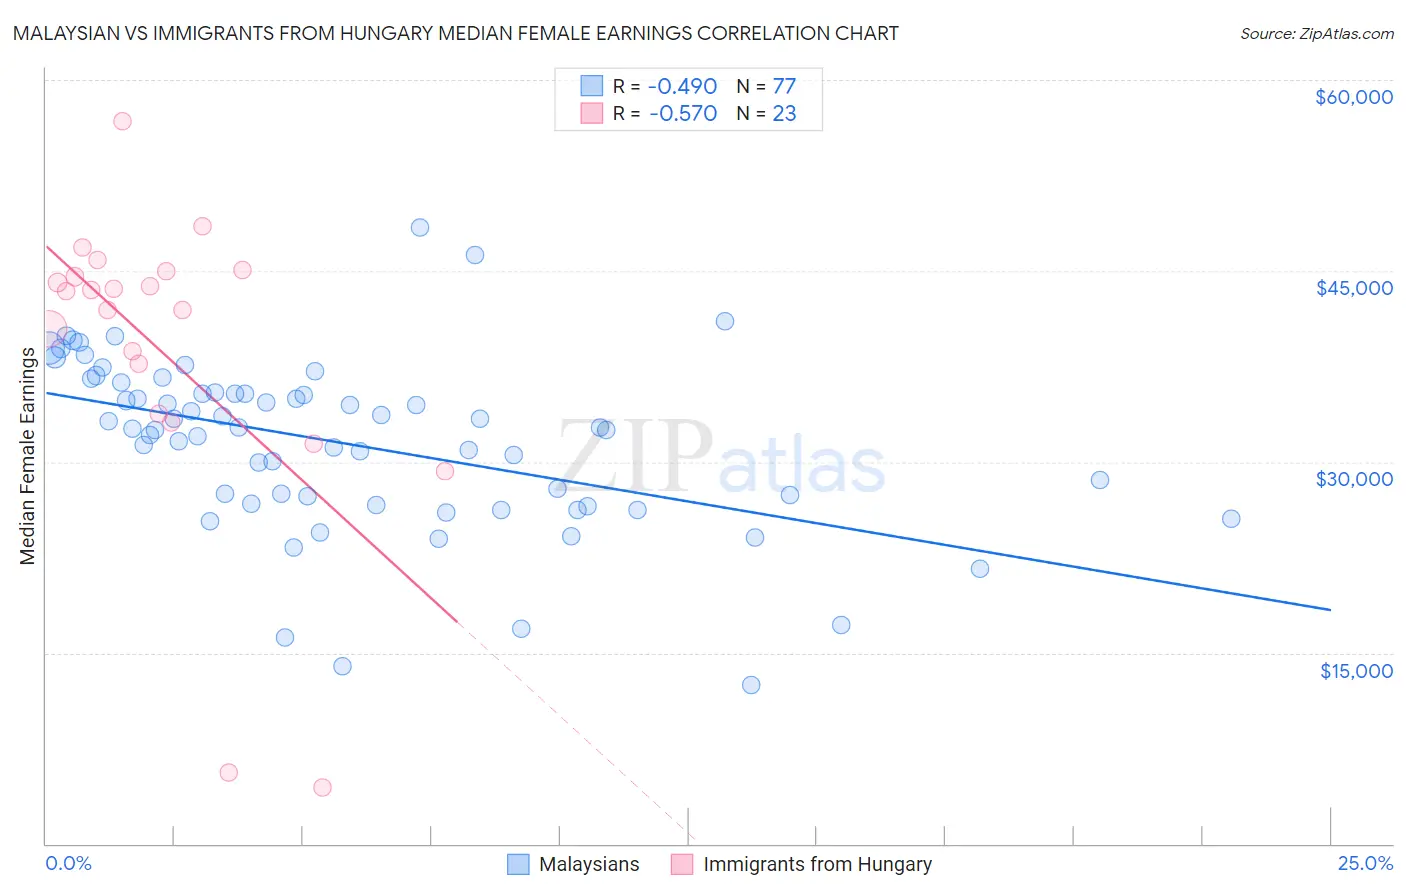
Malaysian vs Immigrants from Hungary Median Female Earnings Correlation Chart
The statistical analysis conducted on geographies consisting of 226,078,777 people shows a moderate negative correlation between the proportion of Malaysians and median female earnings in the United States with a correlation coefficient (R) of -0.490 and weighted average of $37,298. Similarly, the statistical analysis conducted on geographies consisting of 195,658,661 people shows a substantial negative correlation between the proportion of Immigrants from Hungary and median female earnings in the United States with a correlation coefficient (R) of -0.570 and weighted average of $41,820, a difference of 12.1%.
Median Female Earnings Correlation Summary
| Measurement | Malaysian | Immigrants from Hungary |
| Minimum | $12,451 | $4,461 |
| Maximum | $48,393 | $56,794 |
| Range | $35,942 | $52,333 |
| Mean | $31,448 | $38,664 |
| Median | $32,647 | $43,380 |
| Interquartile 25% (IQ1) | $26,696 | $33,775 |
| Interquartile 75% (IQ3) | $35,386 | $45,019 |
| Interquartile Range (IQR) | $8,690 | $11,243 |
| Standard Deviation (Sample) | $6,791 | $12,200 |
| Standard Deviation (Population) | $6,747 | $11,932 |
Similar Demographics by Median Female Earnings
Demographics Similar to Malaysians by Median Female Earnings
In terms of median female earnings, the demographic groups most similar to Malaysians are Venezuelan ($37,282, a difference of 0.040%), Dutch ($37,339, a difference of 0.11%), Scotch-Irish ($37,383, a difference of 0.23%), Belizean ($37,429, a difference of 0.35%), and German Russian ($37,105, a difference of 0.52%).
| Demographics | Rating | Rank | Median Female Earnings |
| Whites/Caucasians | 1.1 /100 | #254 | Tragic $37,531 |
| Colville | 1.1 /100 | #255 | Tragic $37,514 |
| Samoans | 1.0 /100 | #256 | Tragic $37,498 |
| Hawaiians | 1.0 /100 | #257 | Tragic $37,497 |
| Belizeans | 0.9 /100 | #258 | Tragic $37,429 |
| Scotch-Irish | 0.8 /100 | #259 | Tragic $37,383 |
| Dutch | 0.7 /100 | #260 | Tragic $37,339 |
| Malaysians | 0.7 /100 | #261 | Tragic $37,298 |
| Venezuelans | 0.7 /100 | #262 | Tragic $37,282 |
| German Russians | 0.5 /100 | #263 | Tragic $37,105 |
| Salvadorans | 0.4 /100 | #264 | Tragic $37,083 |
| Immigrants | Belize | 0.4 /100 | #265 | Tragic $37,056 |
| Dominicans | 0.4 /100 | #266 | Tragic $37,046 |
| Immigrants | Nonimmigrants | 0.4 /100 | #267 | Tragic $37,024 |
| Cree | 0.4 /100 | #268 | Tragic $37,018 |
Demographics Similar to Immigrants from Hungary by Median Female Earnings
In terms of median female earnings, the demographic groups most similar to Immigrants from Hungary are South African ($41,825, a difference of 0.010%), Moroccan ($41,872, a difference of 0.12%), Immigrants from Netherlands ($41,870, a difference of 0.12%), Immigrants from Scotland ($41,771, a difference of 0.12%), and Immigrants from Grenada ($41,932, a difference of 0.27%).
| Demographics | Rating | Rank | Median Female Earnings |
| Ukrainians | 99.2 /100 | #90 | Exceptional $42,015 |
| Immigrants | Western Europe | 99.2 /100 | #91 | Exceptional $41,990 |
| Argentineans | 99.1 /100 | #92 | Exceptional $41,952 |
| Immigrants | Grenada | 99.0 /100 | #93 | Exceptional $41,932 |
| Moroccans | 98.9 /100 | #94 | Exceptional $41,872 |
| Immigrants | Netherlands | 98.9 /100 | #95 | Exceptional $41,870 |
| South Africans | 98.8 /100 | #96 | Exceptional $41,825 |
| Immigrants | Hungary | 98.8 /100 | #97 | Exceptional $41,820 |
| Immigrants | Scotland | 98.7 /100 | #98 | Exceptional $41,771 |
| Immigrants | Barbados | 98.4 /100 | #99 | Exceptional $41,685 |
| Romanians | 98.3 /100 | #100 | Exceptional $41,663 |
| Immigrants | Fiji | 98.3 /100 | #101 | Exceptional $41,656 |
| Immigrants | Poland | 98.2 /100 | #102 | Exceptional $41,630 |
| Immigrants | Argentina | 97.9 /100 | #103 | Exceptional $41,554 |
| Immigrants | Zimbabwe | 97.8 /100 | #104 | Exceptional $41,527 |