Malaysian vs Hispanic or Latino Median Female Earnings
COMPARE
Malaysian
Hispanic or Latino
Median Female Earnings
Median Female Earnings Comparison
Malaysians
Hispanics or Latinos
$37,298
MEDIAN FEMALE EARNINGS
0.7/ 100
METRIC RATING
261st/ 347
METRIC RANK
$34,421
MEDIAN FEMALE EARNINGS
0.0/ 100
METRIC RATING
321st/ 347
METRIC RANK
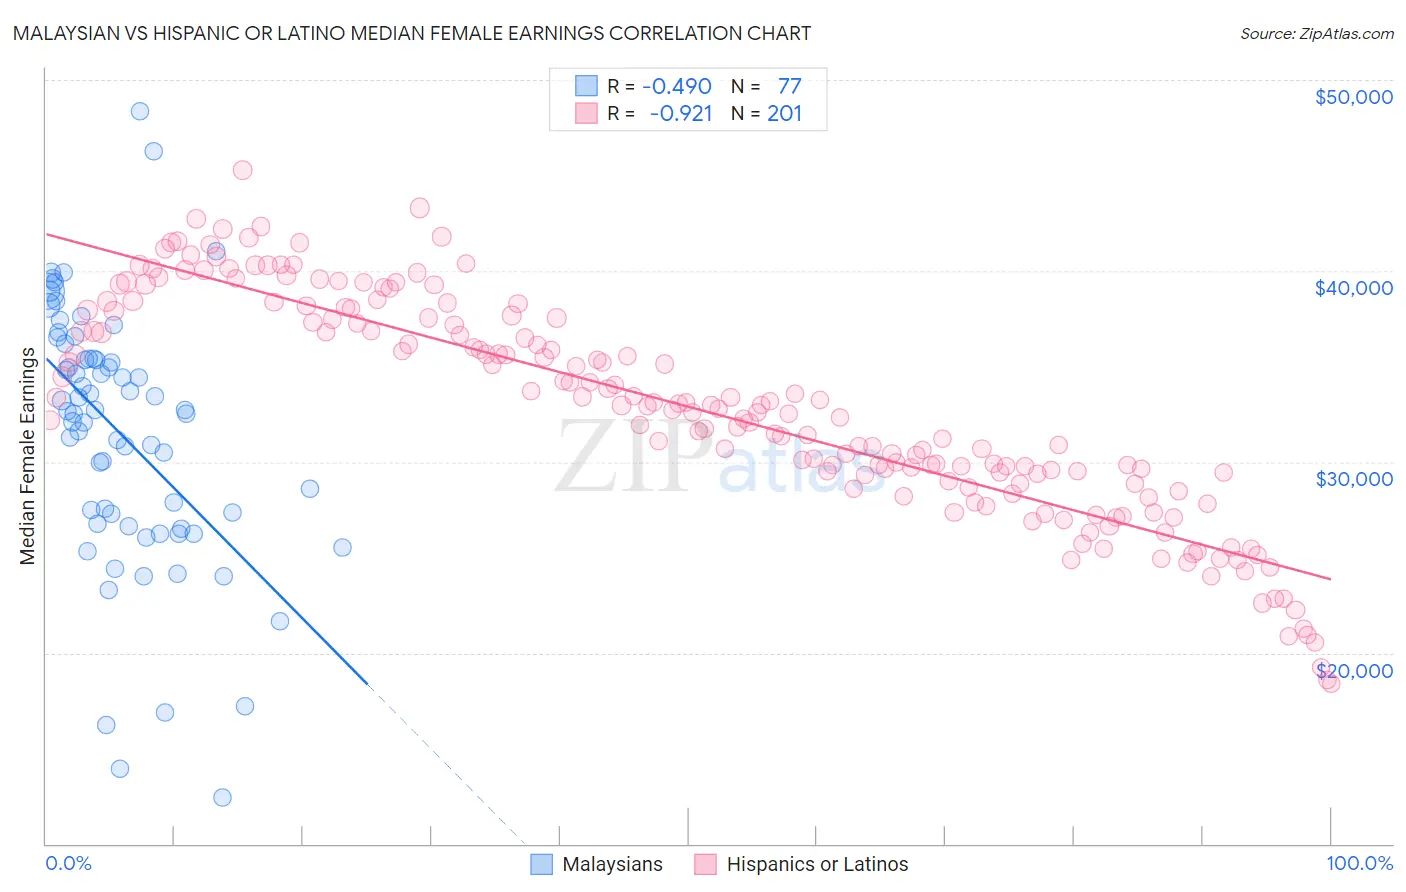
Malaysian vs Hispanic or Latino Median Female Earnings Correlation Chart
The statistical analysis conducted on geographies consisting of 226,078,777 people shows a moderate negative correlation between the proportion of Malaysians and median female earnings in the United States with a correlation coefficient (R) of -0.490 and weighted average of $37,298. Similarly, the statistical analysis conducted on geographies consisting of 576,408,721 people shows a near-perfect negative correlation between the proportion of Hispanics or Latinos and median female earnings in the United States with a correlation coefficient (R) of -0.921 and weighted average of $34,421, a difference of 8.4%.
Median Female Earnings Correlation Summary
| Measurement | Malaysian | Hispanic or Latino |
| Minimum | $12,451 | $18,390 |
| Maximum | $48,393 | $45,279 |
| Range | $35,942 | $26,890 |
| Mean | $31,448 | $32,838 |
| Median | $32,647 | $32,964 |
| Interquartile 25% (IQ1) | $26,696 | $29,181 |
| Interquartile 75% (IQ3) | $35,386 | $37,606 |
| Interquartile Range (IQR) | $8,690 | $8,426 |
| Standard Deviation (Sample) | $6,791 | $5,710 |
| Standard Deviation (Population) | $6,747 | $5,696 |
Similar Demographics by Median Female Earnings
Demographics Similar to Malaysians by Median Female Earnings
In terms of median female earnings, the demographic groups most similar to Malaysians are Venezuelan ($37,282, a difference of 0.040%), Dutch ($37,339, a difference of 0.11%), Scotch-Irish ($37,383, a difference of 0.23%), Belizean ($37,429, a difference of 0.35%), and German Russian ($37,105, a difference of 0.52%).
| Demographics | Rating | Rank | Median Female Earnings |
| Whites/Caucasians | 1.1 /100 | #254 | Tragic $37,531 |
| Colville | 1.1 /100 | #255 | Tragic $37,514 |
| Samoans | 1.0 /100 | #256 | Tragic $37,498 |
| Hawaiians | 1.0 /100 | #257 | Tragic $37,497 |
| Belizeans | 0.9 /100 | #258 | Tragic $37,429 |
| Scotch-Irish | 0.8 /100 | #259 | Tragic $37,383 |
| Dutch | 0.7 /100 | #260 | Tragic $37,339 |
| Malaysians | 0.7 /100 | #261 | Tragic $37,298 |
| Venezuelans | 0.7 /100 | #262 | Tragic $37,282 |
| German Russians | 0.5 /100 | #263 | Tragic $37,105 |
| Salvadorans | 0.4 /100 | #264 | Tragic $37,083 |
| Immigrants | Belize | 0.4 /100 | #265 | Tragic $37,056 |
| Dominicans | 0.4 /100 | #266 | Tragic $37,046 |
| Immigrants | Nonimmigrants | 0.4 /100 | #267 | Tragic $37,024 |
| Cree | 0.4 /100 | #268 | Tragic $37,018 |
Demographics Similar to Hispanics or Latinos by Median Female Earnings
In terms of median female earnings, the demographic groups most similar to Hispanics or Latinos are Chickasaw ($34,414, a difference of 0.020%), Seminole ($34,385, a difference of 0.11%), Immigrants from Congo ($34,317, a difference of 0.31%), Immigrants from Honduras ($34,647, a difference of 0.66%), and Shoshone ($34,677, a difference of 0.74%).
| Demographics | Rating | Rank | Median Female Earnings |
| Apache | 0.0 /100 | #314 | Tragic $34,895 |
| Pennsylvania Germans | 0.0 /100 | #315 | Tragic $34,802 |
| Cherokee | 0.0 /100 | #316 | Tragic $34,742 |
| Potawatomi | 0.0 /100 | #317 | Tragic $34,739 |
| Immigrants | Yemen | 0.0 /100 | #318 | Tragic $34,693 |
| Shoshone | 0.0 /100 | #319 | Tragic $34,677 |
| Immigrants | Honduras | 0.0 /100 | #320 | Tragic $34,647 |
| Hispanics or Latinos | 0.0 /100 | #321 | Tragic $34,421 |
| Chickasaw | 0.0 /100 | #322 | Tragic $34,414 |
| Seminole | 0.0 /100 | #323 | Tragic $34,385 |
| Immigrants | Congo | 0.0 /100 | #324 | Tragic $34,317 |
| Dutch West Indians | 0.0 /100 | #325 | Tragic $34,106 |
| Kiowa | 0.0 /100 | #326 | Tragic $34,074 |
| Cajuns | 0.0 /100 | #327 | Tragic $34,034 |
| Immigrants | Central America | 0.0 /100 | #328 | Tragic $33,953 |