Immigrants from England vs Immigrants from Hungary Median Female Earnings
COMPARE
Immigrants from England
Immigrants from Hungary
Median Female Earnings
Median Female Earnings Comparison
Immigrants from England
Immigrants from Hungary
$41,277
MEDIAN FEMALE EARNINGS
96.4/ 100
METRIC RATING
114th/ 347
METRIC RANK
$41,820
MEDIAN FEMALE EARNINGS
98.8/ 100
METRIC RATING
97th/ 347
METRIC RANK
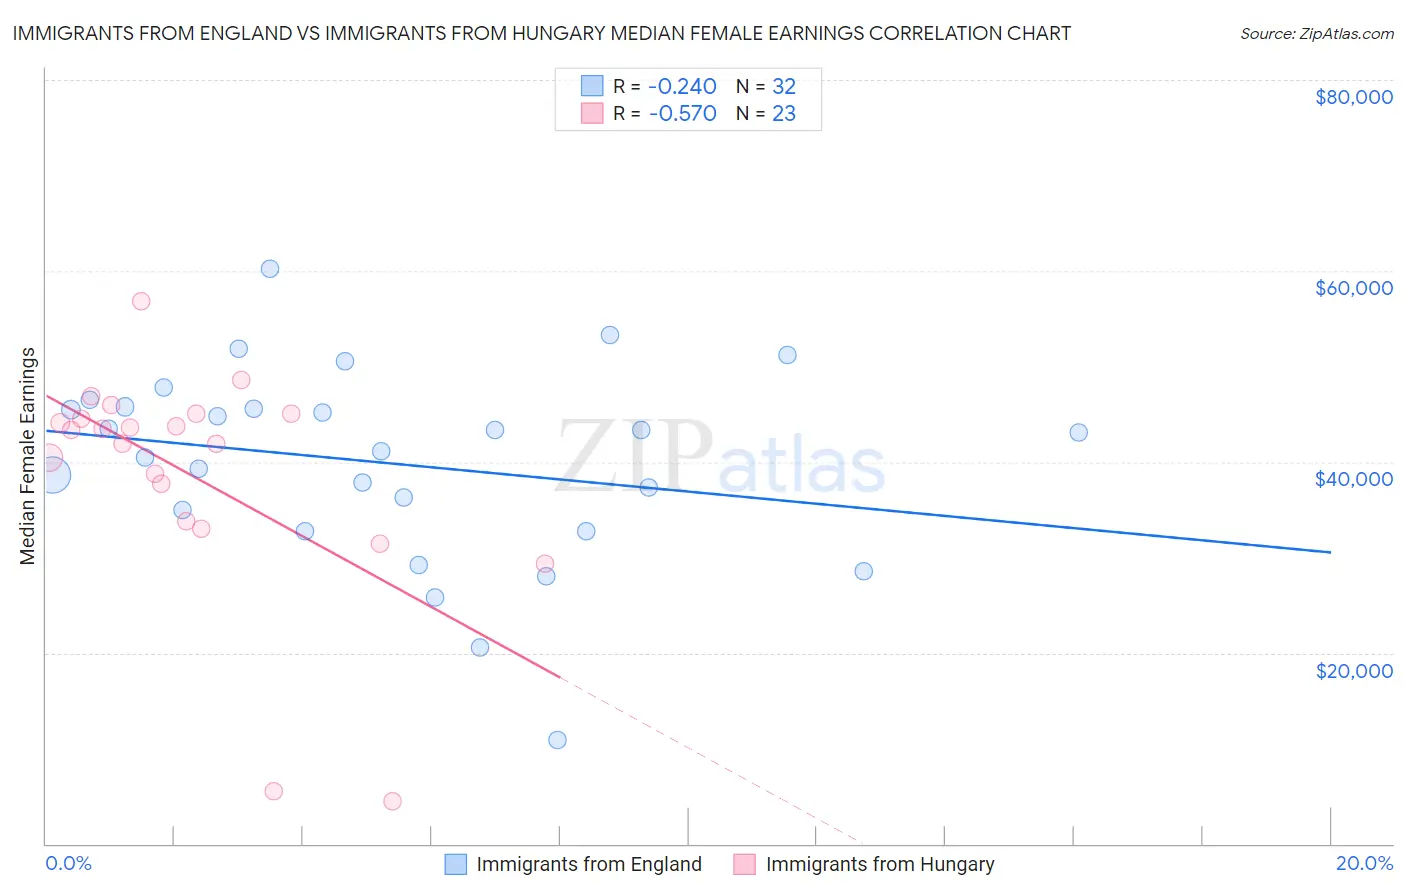
Immigrants from England vs Immigrants from Hungary Median Female Earnings Correlation Chart
The statistical analysis conducted on geographies consisting of 391,639,302 people shows a weak negative correlation between the proportion of Immigrants from England and median female earnings in the United States with a correlation coefficient (R) of -0.240 and weighted average of $41,277. Similarly, the statistical analysis conducted on geographies consisting of 195,658,661 people shows a substantial negative correlation between the proportion of Immigrants from Hungary and median female earnings in the United States with a correlation coefficient (R) of -0.570 and weighted average of $41,820, a difference of 1.3%.
Median Female Earnings Correlation Summary
| Measurement | Immigrants from England | Immigrants from Hungary |
| Minimum | $10,833 | $4,461 |
| Maximum | $60,183 | $56,794 |
| Range | $49,350 | $52,333 |
| Mean | $39,877 | $38,664 |
| Median | $42,129 | $43,380 |
| Interquartile 25% (IQ1) | $33,842 | $33,775 |
| Interquartile 75% (IQ3) | $45,694 | $45,019 |
| Interquartile Range (IQR) | $11,853 | $11,243 |
| Standard Deviation (Sample) | $10,217 | $12,200 |
| Standard Deviation (Population) | $10,056 | $11,932 |
Demographics Similar to Immigrants from England and Immigrants from Hungary by Median Female Earnings
In terms of median female earnings, the demographic groups most similar to Immigrants from England are Korean ($41,276, a difference of 0.0%), Macedonian ($41,286, a difference of 0.020%), Immigrants from North America ($41,319, a difference of 0.10%), Immigrants from Canada ($41,373, a difference of 0.23%), and Immigrants from Western Asia ($41,375, a difference of 0.24%). Similarly, the demographic groups most similar to Immigrants from Hungary are South African ($41,825, a difference of 0.010%), Immigrants from Netherlands ($41,870, a difference of 0.12%), Immigrants from Scotland ($41,771, a difference of 0.12%), Immigrants from Barbados ($41,685, a difference of 0.32%), and Romanian ($41,663, a difference of 0.38%).
| Demographics | Rating | Rank | Median Female Earnings |
| Immigrants | Netherlands | 98.9 /100 | #95 | Exceptional $41,870 |
| South Africans | 98.8 /100 | #96 | Exceptional $41,825 |
| Immigrants | Hungary | 98.8 /100 | #97 | Exceptional $41,820 |
| Immigrants | Scotland | 98.7 /100 | #98 | Exceptional $41,771 |
| Immigrants | Barbados | 98.4 /100 | #99 | Exceptional $41,685 |
| Romanians | 98.3 /100 | #100 | Exceptional $41,663 |
| Immigrants | Fiji | 98.3 /100 | #101 | Exceptional $41,656 |
| Immigrants | Poland | 98.2 /100 | #102 | Exceptional $41,630 |
| Immigrants | Argentina | 97.9 /100 | #103 | Exceptional $41,554 |
| Immigrants | Zimbabwe | 97.8 /100 | #104 | Exceptional $41,527 |
| Italians | 97.7 /100 | #105 | Exceptional $41,505 |
| Immigrants | Eritrea | 97.6 /100 | #106 | Exceptional $41,485 |
| Palestinians | 97.6 /100 | #107 | Exceptional $41,484 |
| Jordanians | 97.5 /100 | #108 | Exceptional $41,464 |
| Chinese | 97.5 /100 | #109 | Exceptional $41,461 |
| Immigrants | Western Asia | 97.0 /100 | #110 | Exceptional $41,375 |
| Immigrants | Canada | 97.0 /100 | #111 | Exceptional $41,373 |
| Immigrants | North America | 96.7 /100 | #112 | Exceptional $41,319 |
| Macedonians | 96.4 /100 | #113 | Exceptional $41,286 |
| Immigrants | England | 96.4 /100 | #114 | Exceptional $41,277 |
| Koreans | 96.4 /100 | #115 | Exceptional $41,276 |