Immigrants from Czechoslovakia vs Immigrants from Hungary Median Female Earnings
COMPARE
Immigrants from Czechoslovakia
Immigrants from Hungary
Median Female Earnings
Median Female Earnings Comparison
Immigrants from Czechoslovakia
Immigrants from Hungary
$43,571
MEDIAN FEMALE EARNINGS
100.0/ 100
METRIC RATING
44th/ 347
METRIC RANK
$41,820
MEDIAN FEMALE EARNINGS
98.8/ 100
METRIC RATING
97th/ 347
METRIC RANK
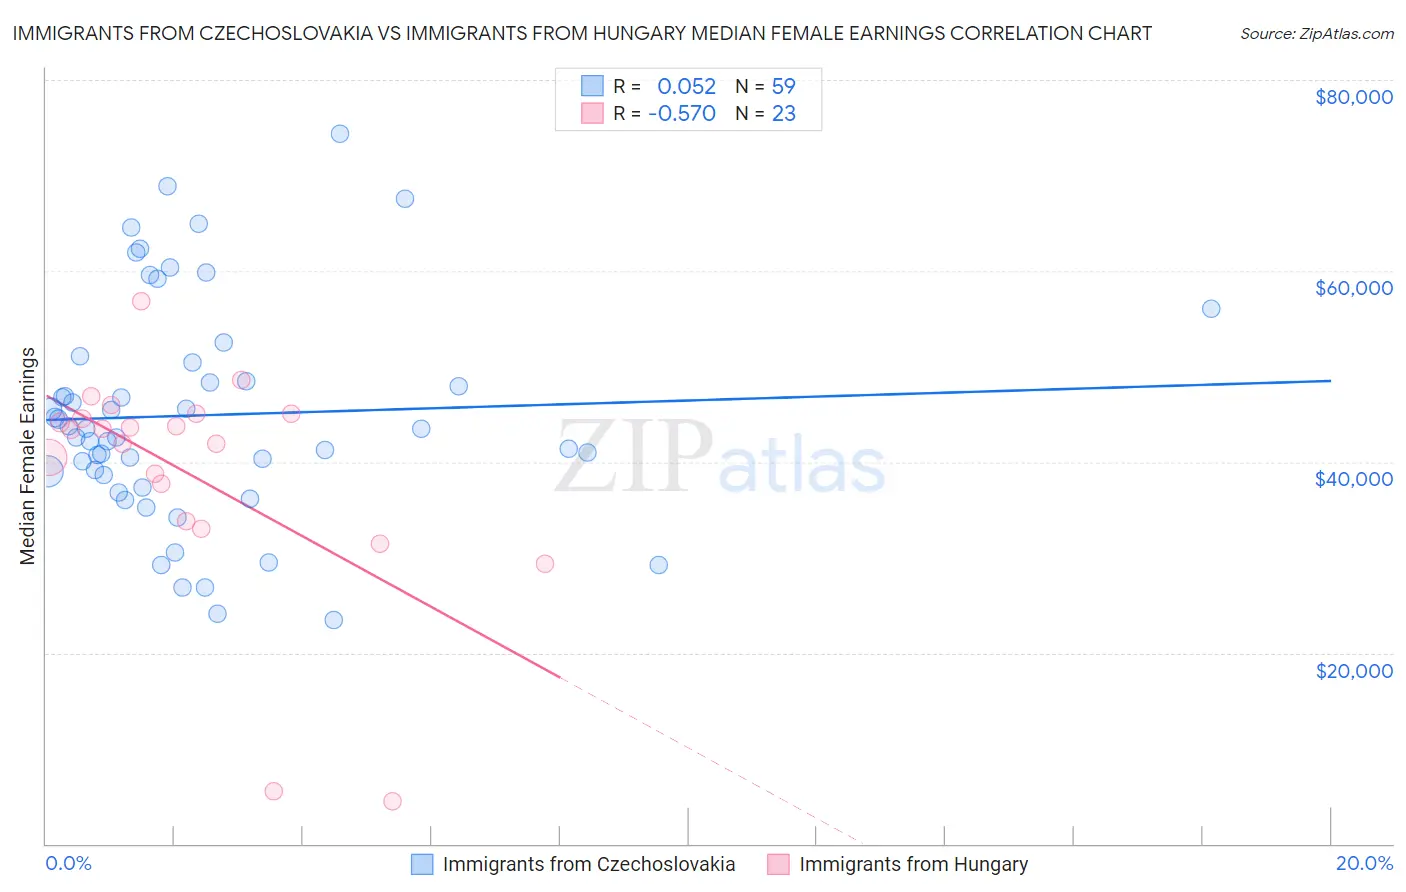
Immigrants from Czechoslovakia vs Immigrants from Hungary Median Female Earnings Correlation Chart
The statistical analysis conducted on geographies consisting of 195,434,199 people shows a slight positive correlation between the proportion of Immigrants from Czechoslovakia and median female earnings in the United States with a correlation coefficient (R) of 0.052 and weighted average of $43,571. Similarly, the statistical analysis conducted on geographies consisting of 195,658,661 people shows a substantial negative correlation between the proportion of Immigrants from Hungary and median female earnings in the United States with a correlation coefficient (R) of -0.570 and weighted average of $41,820, a difference of 4.2%.
Median Female Earnings Correlation Summary
| Measurement | Immigrants from Czechoslovakia | Immigrants from Hungary |
| Minimum | $23,424 | $4,461 |
| Maximum | $74,375 | $56,794 |
| Range | $50,951 | $52,333 |
| Mean | $44,894 | $38,664 |
| Median | $43,456 | $43,380 |
| Interquartile 25% (IQ1) | $38,665 | $33,775 |
| Interquartile 75% (IQ3) | $50,450 | $45,019 |
| Interquartile Range (IQR) | $11,786 | $11,243 |
| Standard Deviation (Sample) | $11,575 | $12,200 |
| Standard Deviation (Population) | $11,476 | $11,932 |
Similar Demographics by Median Female Earnings
Demographics Similar to Immigrants from Czechoslovakia by Median Female Earnings
In terms of median female earnings, the demographic groups most similar to Immigrants from Czechoslovakia are Immigrants from Europe ($43,523, a difference of 0.11%), Bulgarian ($43,638, a difference of 0.15%), Immigrants from Denmark ($43,646, a difference of 0.17%), Bhutanese ($43,648, a difference of 0.18%), and Immigrants from Bolivia ($43,467, a difference of 0.24%).
| Demographics | Rating | Rank | Median Female Earnings |
| Immigrants | Switzerland | 100.0 /100 | #37 | Exceptional $43,996 |
| Latvians | 100.0 /100 | #38 | Exceptional $43,941 |
| Israelis | 100.0 /100 | #39 | Exceptional $43,852 |
| Immigrants | Malaysia | 100.0 /100 | #40 | Exceptional $43,835 |
| Bhutanese | 100.0 /100 | #41 | Exceptional $43,648 |
| Immigrants | Denmark | 100.0 /100 | #42 | Exceptional $43,646 |
| Bulgarians | 100.0 /100 | #43 | Exceptional $43,638 |
| Immigrants | Czechoslovakia | 100.0 /100 | #44 | Exceptional $43,571 |
| Immigrants | Europe | 100.0 /100 | #45 | Exceptional $43,523 |
| Immigrants | Bolivia | 100.0 /100 | #46 | Exceptional $43,467 |
| Bolivians | 100.0 /100 | #47 | Exceptional $43,445 |
| Immigrants | Indonesia | 100.0 /100 | #48 | Exceptional $43,412 |
| Immigrants | Serbia | 100.0 /100 | #49 | Exceptional $43,385 |
| Immigrants | Uzbekistan | 100.0 /100 | #50 | Exceptional $43,363 |
| Maltese | 100.0 /100 | #51 | Exceptional $43,357 |
Demographics Similar to Immigrants from Hungary by Median Female Earnings
In terms of median female earnings, the demographic groups most similar to Immigrants from Hungary are South African ($41,825, a difference of 0.010%), Moroccan ($41,872, a difference of 0.12%), Immigrants from Netherlands ($41,870, a difference of 0.12%), Immigrants from Scotland ($41,771, a difference of 0.12%), and Immigrants from Grenada ($41,932, a difference of 0.27%).
| Demographics | Rating | Rank | Median Female Earnings |
| Ukrainians | 99.2 /100 | #90 | Exceptional $42,015 |
| Immigrants | Western Europe | 99.2 /100 | #91 | Exceptional $41,990 |
| Argentineans | 99.1 /100 | #92 | Exceptional $41,952 |
| Immigrants | Grenada | 99.0 /100 | #93 | Exceptional $41,932 |
| Moroccans | 98.9 /100 | #94 | Exceptional $41,872 |
| Immigrants | Netherlands | 98.9 /100 | #95 | Exceptional $41,870 |
| South Africans | 98.8 /100 | #96 | Exceptional $41,825 |
| Immigrants | Hungary | 98.8 /100 | #97 | Exceptional $41,820 |
| Immigrants | Scotland | 98.7 /100 | #98 | Exceptional $41,771 |
| Immigrants | Barbados | 98.4 /100 | #99 | Exceptional $41,685 |
| Romanians | 98.3 /100 | #100 | Exceptional $41,663 |
| Immigrants | Fiji | 98.3 /100 | #101 | Exceptional $41,656 |
| Immigrants | Poland | 98.2 /100 | #102 | Exceptional $41,630 |
| Immigrants | Argentina | 97.9 /100 | #103 | Exceptional $41,554 |
| Immigrants | Zimbabwe | 97.8 /100 | #104 | Exceptional $41,527 |