Marshallese vs Immigrants from Hungary Median Female Earnings
COMPARE
Marshallese
Immigrants from Hungary
Median Female Earnings
Median Female Earnings Comparison
Marshallese
Immigrants from Hungary
$36,459
MEDIAN FEMALE EARNINGS
0.1/ 100
METRIC RATING
277th/ 347
METRIC RANK
$41,820
MEDIAN FEMALE EARNINGS
98.8/ 100
METRIC RATING
97th/ 347
METRIC RANK
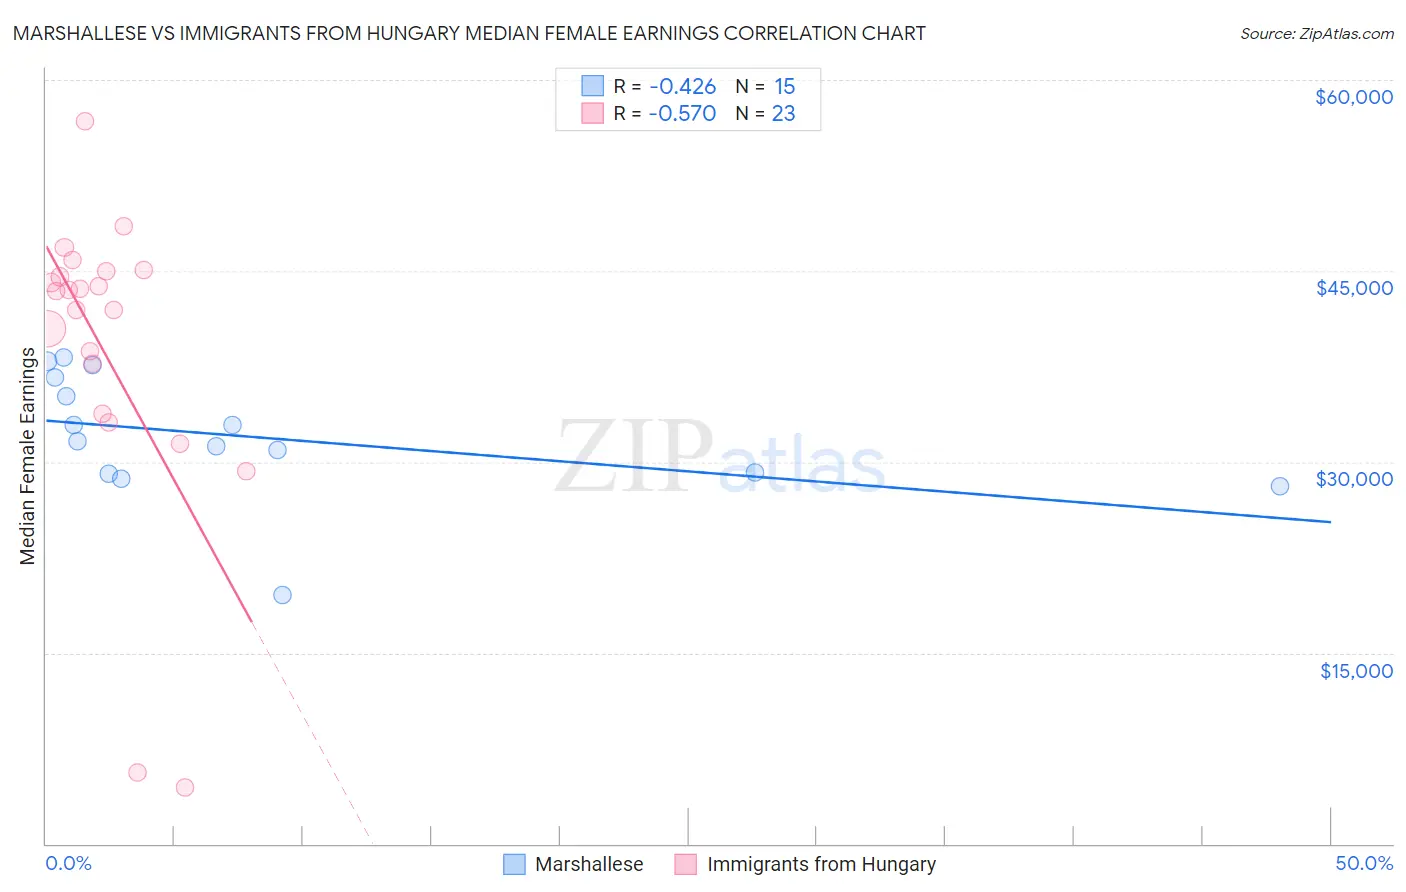
Marshallese vs Immigrants from Hungary Median Female Earnings Correlation Chart
The statistical analysis conducted on geographies consisting of 14,760,991 people shows a moderate negative correlation between the proportion of Marshallese and median female earnings in the United States with a correlation coefficient (R) of -0.426 and weighted average of $36,459. Similarly, the statistical analysis conducted on geographies consisting of 195,658,661 people shows a substantial negative correlation between the proportion of Immigrants from Hungary and median female earnings in the United States with a correlation coefficient (R) of -0.570 and weighted average of $41,820, a difference of 14.7%.
Median Female Earnings Correlation Summary
| Measurement | Marshallese | Immigrants from Hungary |
| Minimum | $19,583 | $4,461 |
| Maximum | $38,170 | $56,794 |
| Range | $18,587 | $52,333 |
| Mean | $31,981 | $38,664 |
| Median | $31,627 | $43,380 |
| Interquartile 25% (IQ1) | $29,109 | $33,775 |
| Interquartile 75% (IQ3) | $36,675 | $45,019 |
| Interquartile Range (IQR) | $7,566 | $11,243 |
| Standard Deviation (Sample) | $4,908 | $12,200 |
| Standard Deviation (Population) | $4,742 | $11,932 |
Similar Demographics by Median Female Earnings
Demographics Similar to Marshallese by Median Female Earnings
In terms of median female earnings, the demographic groups most similar to Marshallese are Central American ($36,492, a difference of 0.090%), U.S. Virgin Islander ($36,424, a difference of 0.10%), Immigrants from Caribbean ($36,414, a difference of 0.12%), Iroquois ($36,408, a difference of 0.14%), and African ($36,530, a difference of 0.19%).
| Demographics | Rating | Rank | Median Female Earnings |
| French American Indians | 0.3 /100 | #270 | Tragic $36,920 |
| Nicaraguans | 0.3 /100 | #271 | Tragic $36,904 |
| Immigrants | Dominican Republic | 0.3 /100 | #272 | Tragic $36,857 |
| Immigrants | Laos | 0.3 /100 | #273 | Tragic $36,841 |
| Immigrants | El Salvador | 0.2 /100 | #274 | Tragic $36,673 |
| Africans | 0.1 /100 | #275 | Tragic $36,530 |
| Central Americans | 0.1 /100 | #276 | Tragic $36,492 |
| Marshallese | 0.1 /100 | #277 | Tragic $36,459 |
| U.S. Virgin Islanders | 0.1 /100 | #278 | Tragic $36,424 |
| Immigrants | Caribbean | 0.1 /100 | #279 | Tragic $36,414 |
| Iroquois | 0.1 /100 | #280 | Tragic $36,408 |
| Spanish Americans | 0.1 /100 | #281 | Tragic $36,391 |
| Haitians | 0.1 /100 | #282 | Tragic $36,374 |
| Immigrants | Haiti | 0.1 /100 | #283 | Tragic $36,203 |
| Indonesians | 0.1 /100 | #284 | Tragic $36,140 |
Demographics Similar to Immigrants from Hungary by Median Female Earnings
In terms of median female earnings, the demographic groups most similar to Immigrants from Hungary are South African ($41,825, a difference of 0.010%), Moroccan ($41,872, a difference of 0.12%), Immigrants from Netherlands ($41,870, a difference of 0.12%), Immigrants from Scotland ($41,771, a difference of 0.12%), and Immigrants from Grenada ($41,932, a difference of 0.27%).
| Demographics | Rating | Rank | Median Female Earnings |
| Ukrainians | 99.2 /100 | #90 | Exceptional $42,015 |
| Immigrants | Western Europe | 99.2 /100 | #91 | Exceptional $41,990 |
| Argentineans | 99.1 /100 | #92 | Exceptional $41,952 |
| Immigrants | Grenada | 99.0 /100 | #93 | Exceptional $41,932 |
| Moroccans | 98.9 /100 | #94 | Exceptional $41,872 |
| Immigrants | Netherlands | 98.9 /100 | #95 | Exceptional $41,870 |
| South Africans | 98.8 /100 | #96 | Exceptional $41,825 |
| Immigrants | Hungary | 98.8 /100 | #97 | Exceptional $41,820 |
| Immigrants | Scotland | 98.7 /100 | #98 | Exceptional $41,771 |
| Immigrants | Barbados | 98.4 /100 | #99 | Exceptional $41,685 |
| Romanians | 98.3 /100 | #100 | Exceptional $41,663 |
| Immigrants | Fiji | 98.3 /100 | #101 | Exceptional $41,656 |
| Immigrants | Poland | 98.2 /100 | #102 | Exceptional $41,630 |
| Immigrants | Argentina | 97.9 /100 | #103 | Exceptional $41,554 |
| Immigrants | Zimbabwe | 97.8 /100 | #104 | Exceptional $41,527 |