Malaysian vs Arab Median Female Earnings
COMPARE
Malaysian
Arab
Median Female Earnings
Median Female Earnings Comparison
Malaysians
Arabs
$37,298
MEDIAN FEMALE EARNINGS
0.7/ 100
METRIC RATING
261st/ 347
METRIC RANK
$40,718
MEDIAN FEMALE EARNINGS
89.3/ 100
METRIC RATING
134th/ 347
METRIC RANK
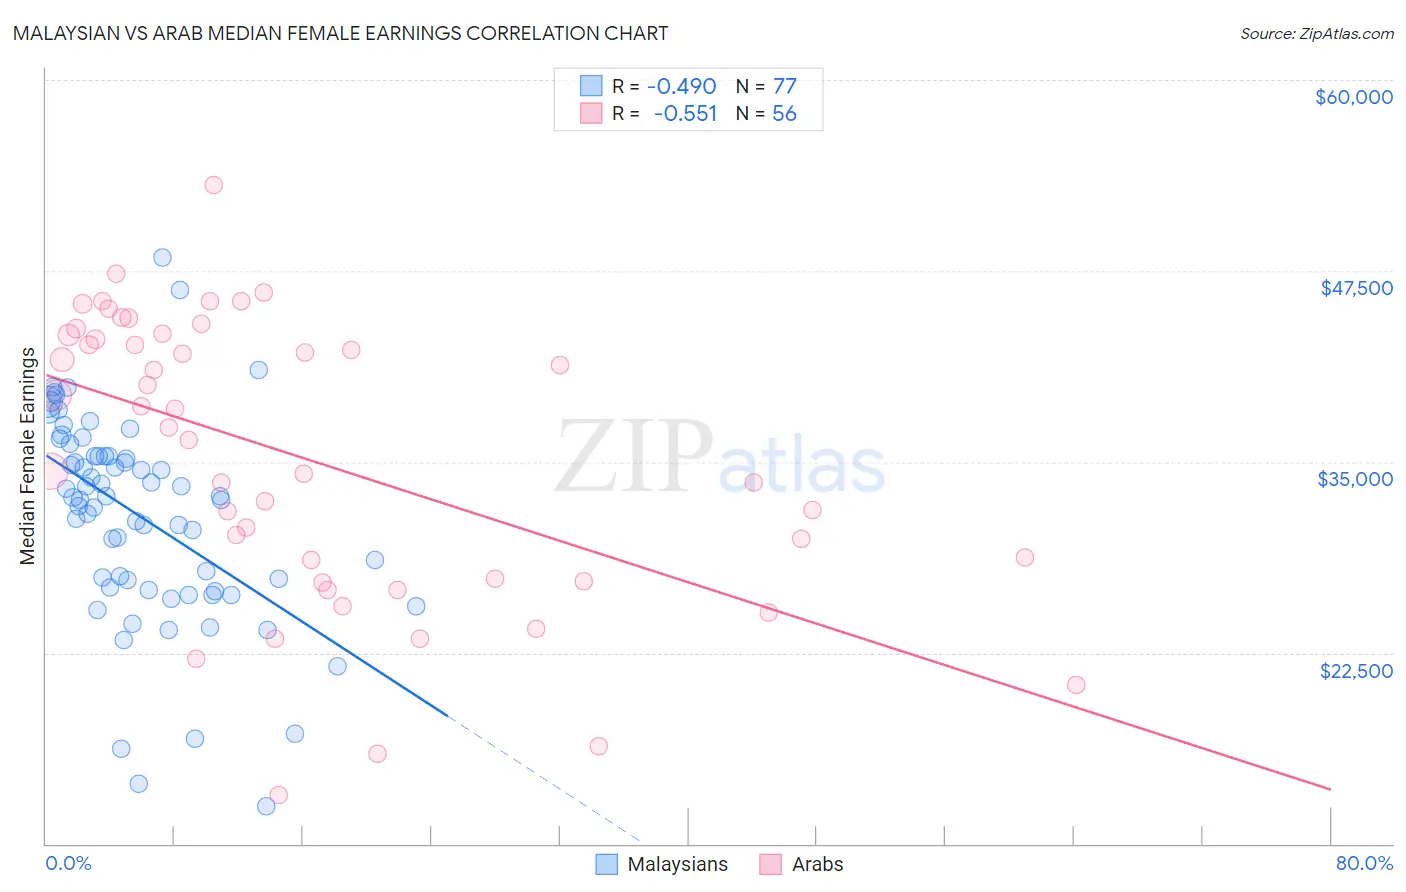
Malaysian vs Arab Median Female Earnings Correlation Chart
The statistical analysis conducted on geographies consisting of 226,078,777 people shows a moderate negative correlation between the proportion of Malaysians and median female earnings in the United States with a correlation coefficient (R) of -0.490 and weighted average of $37,298. Similarly, the statistical analysis conducted on geographies consisting of 486,538,152 people shows a substantial negative correlation between the proportion of Arabs and median female earnings in the United States with a correlation coefficient (R) of -0.551 and weighted average of $40,718, a difference of 9.2%.
Median Female Earnings Correlation Summary
| Measurement | Malaysian | Arab |
| Minimum | $12,451 | $13,173 |
| Maximum | $48,393 | $53,122 |
| Range | $35,942 | $39,949 |
| Mean | $31,448 | $35,183 |
| Median | $32,647 | $36,815 |
| Interquartile 25% (IQ1) | $26,696 | $27,287 |
| Interquartile 75% (IQ3) | $35,386 | $43,150 |
| Interquartile Range (IQR) | $8,690 | $15,863 |
| Standard Deviation (Sample) | $6,791 | $9,334 |
| Standard Deviation (Population) | $6,747 | $9,250 |
Similar Demographics by Median Female Earnings
Demographics Similar to Malaysians by Median Female Earnings
In terms of median female earnings, the demographic groups most similar to Malaysians are Venezuelan ($37,282, a difference of 0.040%), Dutch ($37,339, a difference of 0.11%), Scotch-Irish ($37,383, a difference of 0.23%), Belizean ($37,429, a difference of 0.35%), and German Russian ($37,105, a difference of 0.52%).
| Demographics | Rating | Rank | Median Female Earnings |
| Whites/Caucasians | 1.1 /100 | #254 | Tragic $37,531 |
| Colville | 1.1 /100 | #255 | Tragic $37,514 |
| Samoans | 1.0 /100 | #256 | Tragic $37,498 |
| Hawaiians | 1.0 /100 | #257 | Tragic $37,497 |
| Belizeans | 0.9 /100 | #258 | Tragic $37,429 |
| Scotch-Irish | 0.8 /100 | #259 | Tragic $37,383 |
| Dutch | 0.7 /100 | #260 | Tragic $37,339 |
| Malaysians | 0.7 /100 | #261 | Tragic $37,298 |
| Venezuelans | 0.7 /100 | #262 | Tragic $37,282 |
| German Russians | 0.5 /100 | #263 | Tragic $37,105 |
| Salvadorans | 0.4 /100 | #264 | Tragic $37,083 |
| Immigrants | Belize | 0.4 /100 | #265 | Tragic $37,056 |
| Dominicans | 0.4 /100 | #266 | Tragic $37,046 |
| Immigrants | Nonimmigrants | 0.4 /100 | #267 | Tragic $37,024 |
| Cree | 0.4 /100 | #268 | Tragic $37,018 |
Demographics Similar to Arabs by Median Female Earnings
In terms of median female earnings, the demographic groups most similar to Arabs are Syrian ($40,727, a difference of 0.020%), Immigrants from Nepal ($40,704, a difference of 0.030%), Immigrants from Uganda ($40,739, a difference of 0.050%), Chilean ($40,757, a difference of 0.10%), and Immigrants from Guyana ($40,773, a difference of 0.14%).
| Demographics | Rating | Rank | Median Female Earnings |
| Ugandans | 92.2 /100 | #127 | Exceptional $40,889 |
| Carpatho Rusyns | 91.2 /100 | #128 | Exceptional $40,825 |
| Zimbabweans | 90.8 /100 | #129 | Exceptional $40,798 |
| Immigrants | Guyana | 90.3 /100 | #130 | Exceptional $40,773 |
| Chileans | 90.0 /100 | #131 | Exceptional $40,757 |
| Immigrants | Uganda | 89.7 /100 | #132 | Excellent $40,739 |
| Syrians | 89.5 /100 | #133 | Excellent $40,727 |
| Arabs | 89.3 /100 | #134 | Excellent $40,718 |
| Immigrants | Nepal | 89.0 /100 | #135 | Excellent $40,704 |
| Immigrants | Eastern Africa | 87.7 /100 | #136 | Excellent $40,644 |
| Pakistanis | 86.6 /100 | #137 | Excellent $40,596 |
| Taiwanese | 86.1 /100 | #138 | Excellent $40,576 |
| Immigrants | South Eastern Asia | 85.7 /100 | #139 | Excellent $40,558 |
| Serbians | 85.2 /100 | #140 | Excellent $40,539 |
| Immigrants | Syria | 84.1 /100 | #141 | Excellent $40,499 |