Malaysian vs Peruvian Median Female Earnings
COMPARE
Malaysian
Peruvian
Median Female Earnings
Median Female Earnings Comparison
Malaysians
Peruvians
$37,298
MEDIAN FEMALE EARNINGS
0.7/ 100
METRIC RATING
261st/ 347
METRIC RANK
$40,234
MEDIAN FEMALE EARNINGS
75.3/ 100
METRIC RATING
156th/ 347
METRIC RANK
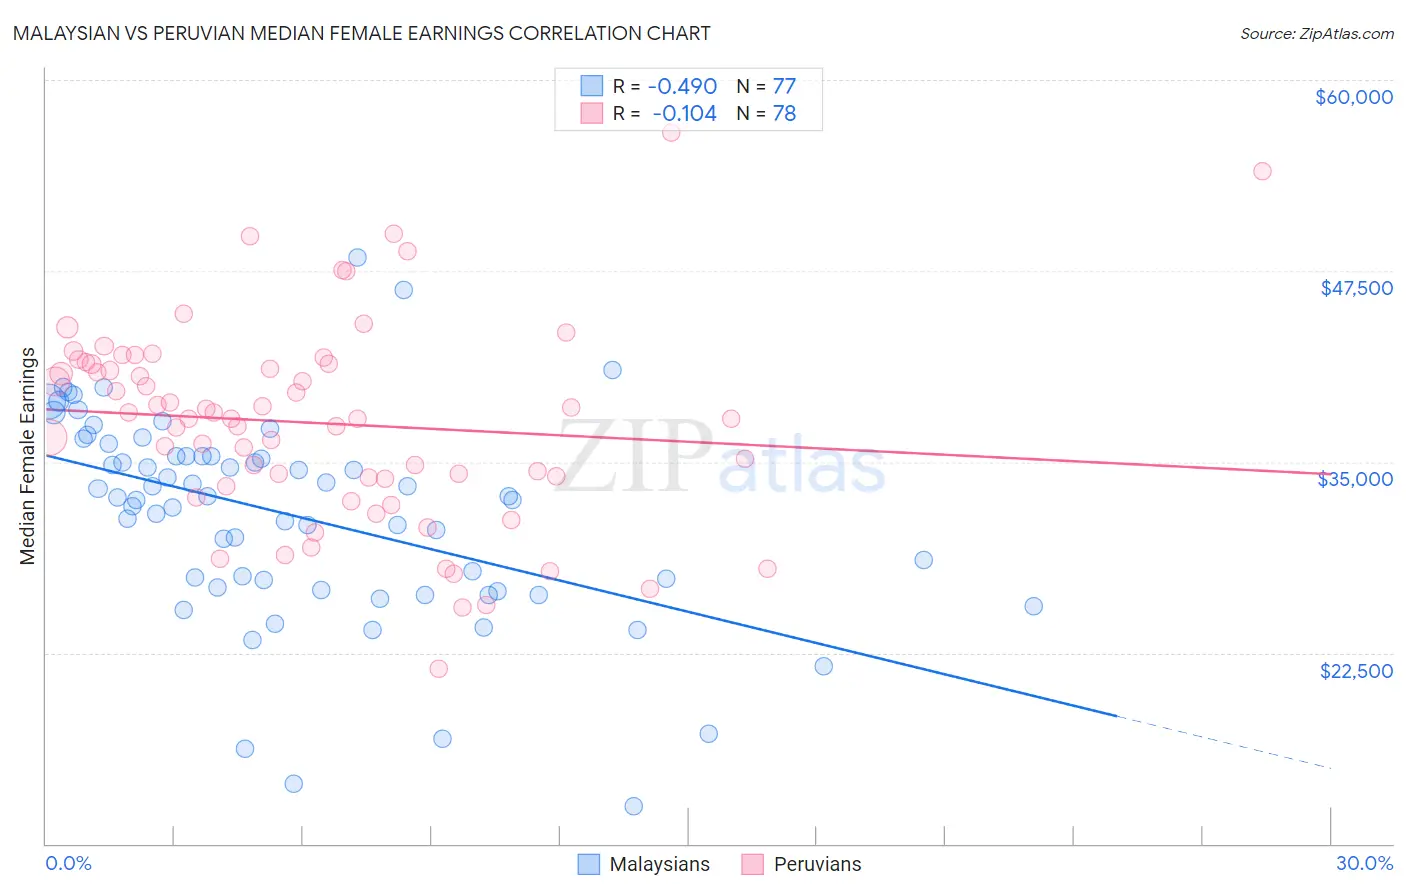
Malaysian vs Peruvian Median Female Earnings Correlation Chart
The statistical analysis conducted on geographies consisting of 226,078,777 people shows a moderate negative correlation between the proportion of Malaysians and median female earnings in the United States with a correlation coefficient (R) of -0.490 and weighted average of $37,298. Similarly, the statistical analysis conducted on geographies consisting of 363,169,099 people shows a poor negative correlation between the proportion of Peruvians and median female earnings in the United States with a correlation coefficient (R) of -0.104 and weighted average of $40,234, a difference of 7.9%.
Median Female Earnings Correlation Summary
| Measurement | Malaysian | Peruvian |
| Minimum | $12,451 | $21,456 |
| Maximum | $48,393 | $56,528 |
| Range | $35,942 | $35,072 |
| Mean | $31,448 | $37,547 |
| Median | $32,647 | $37,836 |
| Interquartile 25% (IQ1) | $26,696 | $33,920 |
| Interquartile 75% (IQ3) | $35,386 | $41,414 |
| Interquartile Range (IQR) | $8,690 | $7,494 |
| Standard Deviation (Sample) | $6,791 | $6,584 |
| Standard Deviation (Population) | $6,747 | $6,542 |
Similar Demographics by Median Female Earnings
Demographics Similar to Malaysians by Median Female Earnings
In terms of median female earnings, the demographic groups most similar to Malaysians are Venezuelan ($37,282, a difference of 0.040%), Dutch ($37,339, a difference of 0.11%), Scotch-Irish ($37,383, a difference of 0.23%), Belizean ($37,429, a difference of 0.35%), and German Russian ($37,105, a difference of 0.52%).
| Demographics | Rating | Rank | Median Female Earnings |
| Whites/Caucasians | 1.1 /100 | #254 | Tragic $37,531 |
| Colville | 1.1 /100 | #255 | Tragic $37,514 |
| Samoans | 1.0 /100 | #256 | Tragic $37,498 |
| Hawaiians | 1.0 /100 | #257 | Tragic $37,497 |
| Belizeans | 0.9 /100 | #258 | Tragic $37,429 |
| Scotch-Irish | 0.8 /100 | #259 | Tragic $37,383 |
| Dutch | 0.7 /100 | #260 | Tragic $37,339 |
| Malaysians | 0.7 /100 | #261 | Tragic $37,298 |
| Venezuelans | 0.7 /100 | #262 | Tragic $37,282 |
| German Russians | 0.5 /100 | #263 | Tragic $37,105 |
| Salvadorans | 0.4 /100 | #264 | Tragic $37,083 |
| Immigrants | Belize | 0.4 /100 | #265 | Tragic $37,056 |
| Dominicans | 0.4 /100 | #266 | Tragic $37,046 |
| Immigrants | Nonimmigrants | 0.4 /100 | #267 | Tragic $37,024 |
| Cree | 0.4 /100 | #268 | Tragic $37,018 |
Demographics Similar to Peruvians by Median Female Earnings
In terms of median female earnings, the demographic groups most similar to Peruvians are Immigrants from Africa ($40,257, a difference of 0.060%), Portuguese ($40,177, a difference of 0.14%), British West Indian ($40,299, a difference of 0.16%), Immigrants from Oceania ($40,297, a difference of 0.16%), and Immigrants from Senegal ($40,157, a difference of 0.19%).
| Demographics | Rating | Rank | Median Female Earnings |
| Immigrants | Cameroon | 79.7 /100 | #149 | Good $40,354 |
| Immigrants | Chile | 79.6 /100 | #150 | Good $40,353 |
| Immigrants | Armenia | 79.2 /100 | #151 | Good $40,340 |
| West Indians | 78.4 /100 | #152 | Good $40,317 |
| British West Indians | 77.7 /100 | #153 | Good $40,299 |
| Immigrants | Oceania | 77.6 /100 | #154 | Good $40,297 |
| Immigrants | Africa | 76.2 /100 | #155 | Good $40,257 |
| Peruvians | 75.3 /100 | #156 | Good $40,234 |
| Portuguese | 73.0 /100 | #157 | Good $40,177 |
| Immigrants | Senegal | 72.2 /100 | #158 | Good $40,157 |
| Immigrants | Vietnam | 72.0 /100 | #159 | Good $40,153 |
| Inupiat | 68.9 /100 | #160 | Good $40,080 |
| Alsatians | 68.0 /100 | #161 | Good $40,060 |
| South American Indians | 66.1 /100 | #162 | Good $40,019 |
| Lebanese | 65.5 /100 | #163 | Good $40,006 |