Immigrants from Kazakhstan vs Immigrants from Hungary Median Female Earnings
COMPARE
Immigrants from Kazakhstan
Immigrants from Hungary
Median Female Earnings
Median Female Earnings Comparison
Immigrants from Kazakhstan
Immigrants from Hungary
$42,386
MEDIAN FEMALE EARNINGS
99.6/ 100
METRIC RATING
78th/ 347
METRIC RANK
$41,820
MEDIAN FEMALE EARNINGS
98.8/ 100
METRIC RATING
97th/ 347
METRIC RANK
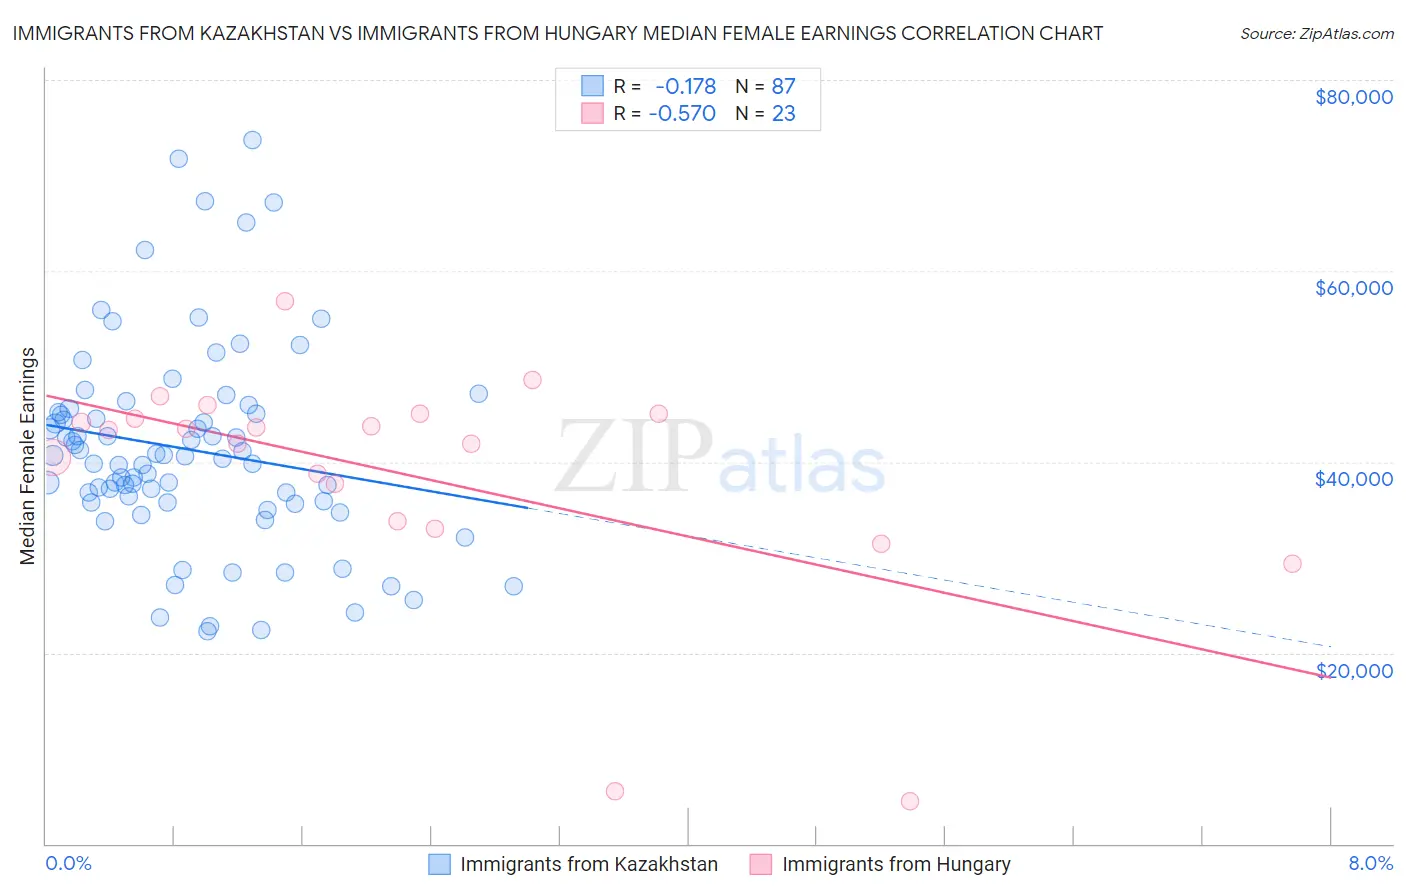
Immigrants from Kazakhstan vs Immigrants from Hungary Median Female Earnings Correlation Chart
The statistical analysis conducted on geographies consisting of 124,420,092 people shows a poor negative correlation between the proportion of Immigrants from Kazakhstan and median female earnings in the United States with a correlation coefficient (R) of -0.178 and weighted average of $42,386. Similarly, the statistical analysis conducted on geographies consisting of 195,658,661 people shows a substantial negative correlation between the proportion of Immigrants from Hungary and median female earnings in the United States with a correlation coefficient (R) of -0.570 and weighted average of $41,820, a difference of 1.3%.
Median Female Earnings Correlation Summary
| Measurement | Immigrants from Kazakhstan | Immigrants from Hungary |
| Minimum | $22,250 | $4,461 |
| Maximum | $73,684 | $56,794 |
| Range | $51,434 | $52,333 |
| Mean | $41,300 | $38,664 |
| Median | $40,614 | $43,380 |
| Interquartile 25% (IQ1) | $35,762 | $33,775 |
| Interquartile 75% (IQ3) | $45,166 | $45,019 |
| Interquartile Range (IQR) | $9,404 | $11,243 |
| Standard Deviation (Sample) | $10,623 | $12,200 |
| Standard Deviation (Population) | $10,562 | $11,932 |
Demographics Similar to Immigrants from Kazakhstan and Immigrants from Hungary by Median Female Earnings
In terms of median female earnings, the demographic groups most similar to Immigrants from Kazakhstan are Immigrants from Albania ($42,388, a difference of 0.0%), Greek ($42,336, a difference of 0.12%), Immigrants from Moldova ($42,304, a difference of 0.19%), Immigrants from Southern Europe ($42,275, a difference of 0.26%), and Immigrants from Morocco ($42,229, a difference of 0.37%). Similarly, the demographic groups most similar to Immigrants from Hungary are South African ($41,825, a difference of 0.010%), Moroccan ($41,872, a difference of 0.12%), Immigrants from Netherlands ($41,870, a difference of 0.12%), Immigrants from Grenada ($41,932, a difference of 0.27%), and Argentinean ($41,952, a difference of 0.32%).
| Demographics | Rating | Rank | Median Female Earnings |
| Immigrants | Albania | 99.6 /100 | #77 | Exceptional $42,388 |
| Immigrants | Kazakhstan | 99.6 /100 | #78 | Exceptional $42,386 |
| Greeks | 99.6 /100 | #79 | Exceptional $42,336 |
| Immigrants | Moldova | 99.6 /100 | #80 | Exceptional $42,304 |
| Immigrants | Southern Europe | 99.5 /100 | #81 | Exceptional $42,275 |
| Immigrants | Morocco | 99.5 /100 | #82 | Exceptional $42,229 |
| Immigrants | Sierra Leone | 99.5 /100 | #83 | Exceptional $42,214 |
| Armenians | 99.5 /100 | #84 | Exceptional $42,212 |
| Laotians | 99.4 /100 | #85 | Exceptional $42,133 |
| Immigrants | St. Vincent and the Grenadines | 99.3 /100 | #86 | Exceptional $42,108 |
| Lithuanians | 99.3 /100 | #87 | Exceptional $42,108 |
| Immigrants | Northern Africa | 99.3 /100 | #88 | Exceptional $42,084 |
| Immigrants | Afghanistan | 99.3 /100 | #89 | Exceptional $42,055 |
| Ukrainians | 99.2 /100 | #90 | Exceptional $42,015 |
| Immigrants | Western Europe | 99.2 /100 | #91 | Exceptional $41,990 |
| Argentineans | 99.1 /100 | #92 | Exceptional $41,952 |
| Immigrants | Grenada | 99.0 /100 | #93 | Exceptional $41,932 |
| Moroccans | 98.9 /100 | #94 | Exceptional $41,872 |
| Immigrants | Netherlands | 98.9 /100 | #95 | Exceptional $41,870 |
| South Africans | 98.8 /100 | #96 | Exceptional $41,825 |
| Immigrants | Hungary | 98.8 /100 | #97 | Exceptional $41,820 |