Malaysian vs Immigrants from Guatemala Median Female Earnings
COMPARE
Malaysian
Immigrants from Guatemala
Median Female Earnings
Median Female Earnings Comparison
Malaysians
Immigrants from Guatemala
$37,298
MEDIAN FEMALE EARNINGS
0.7/ 100
METRIC RATING
261st/ 347
METRIC RANK
$35,444
MEDIAN FEMALE EARNINGS
0.0/ 100
METRIC RATING
299th/ 347
METRIC RANK
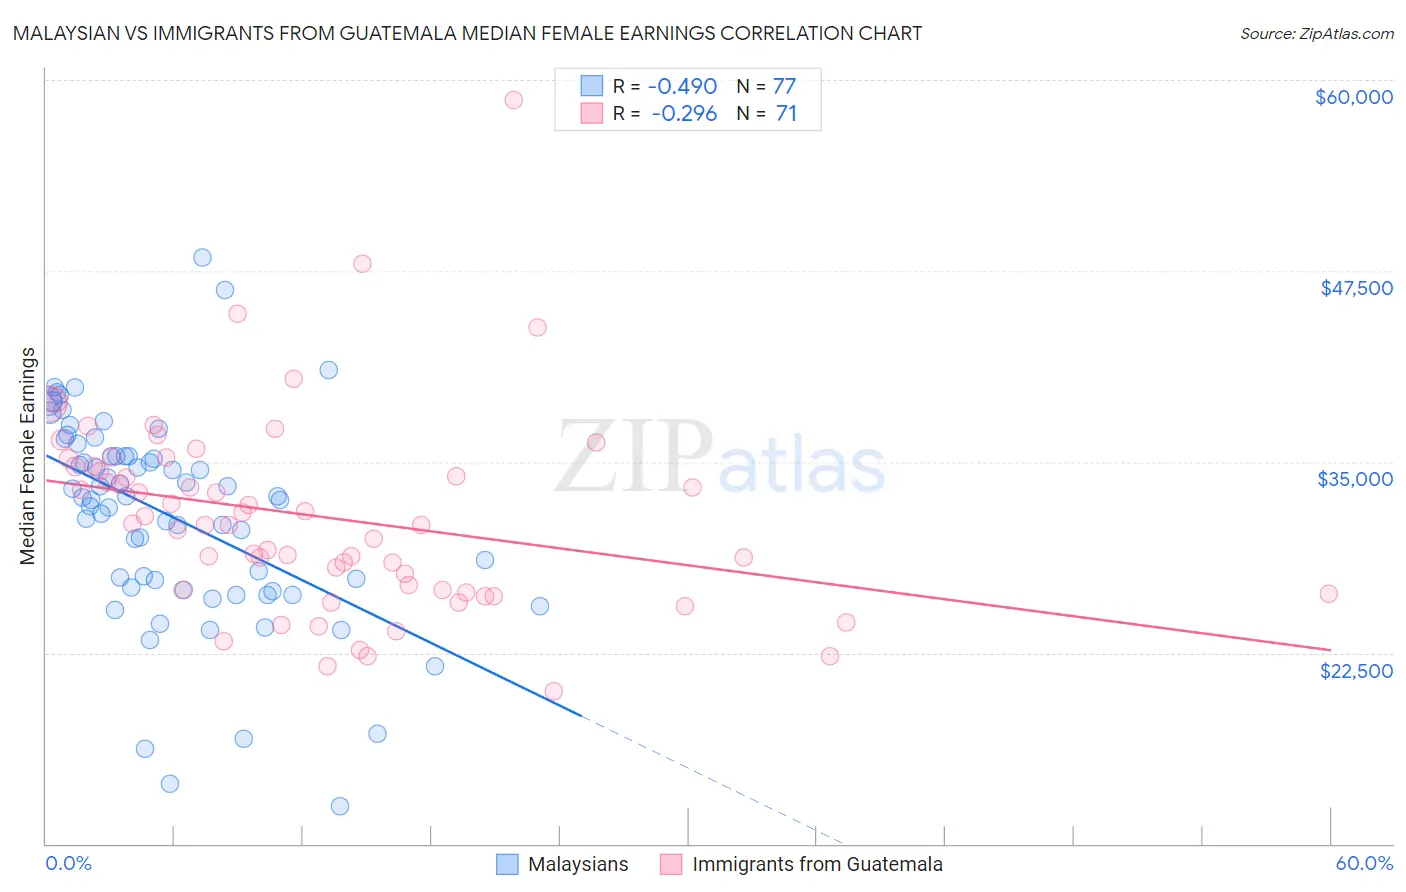
Malaysian vs Immigrants from Guatemala Median Female Earnings Correlation Chart
The statistical analysis conducted on geographies consisting of 226,078,777 people shows a moderate negative correlation between the proportion of Malaysians and median female earnings in the United States with a correlation coefficient (R) of -0.490 and weighted average of $37,298. Similarly, the statistical analysis conducted on geographies consisting of 377,157,500 people shows a weak negative correlation between the proportion of Immigrants from Guatemala and median female earnings in the United States with a correlation coefficient (R) of -0.296 and weighted average of $35,444, a difference of 5.2%.
Median Female Earnings Correlation Summary
| Measurement | Malaysian | Immigrants from Guatemala |
| Minimum | $12,451 | $20,000 |
| Maximum | $48,393 | $58,669 |
| Range | $35,942 | $38,669 |
| Mean | $31,448 | $31,424 |
| Median | $32,647 | $30,854 |
| Interquartile 25% (IQ1) | $26,696 | $26,583 |
| Interquartile 75% (IQ3) | $35,386 | $34,723 |
| Interquartile Range (IQR) | $8,690 | $8,140 |
| Standard Deviation (Sample) | $6,791 | $6,504 |
| Standard Deviation (Population) | $6,747 | $6,458 |
Similar Demographics by Median Female Earnings
Demographics Similar to Malaysians by Median Female Earnings
In terms of median female earnings, the demographic groups most similar to Malaysians are Venezuelan ($37,282, a difference of 0.040%), Dutch ($37,339, a difference of 0.11%), Scotch-Irish ($37,383, a difference of 0.23%), Belizean ($37,429, a difference of 0.35%), and German Russian ($37,105, a difference of 0.52%).
| Demographics | Rating | Rank | Median Female Earnings |
| Whites/Caucasians | 1.1 /100 | #254 | Tragic $37,531 |
| Colville | 1.1 /100 | #255 | Tragic $37,514 |
| Samoans | 1.0 /100 | #256 | Tragic $37,498 |
| Hawaiians | 1.0 /100 | #257 | Tragic $37,497 |
| Belizeans | 0.9 /100 | #258 | Tragic $37,429 |
| Scotch-Irish | 0.8 /100 | #259 | Tragic $37,383 |
| Dutch | 0.7 /100 | #260 | Tragic $37,339 |
| Malaysians | 0.7 /100 | #261 | Tragic $37,298 |
| Venezuelans | 0.7 /100 | #262 | Tragic $37,282 |
| German Russians | 0.5 /100 | #263 | Tragic $37,105 |
| Salvadorans | 0.4 /100 | #264 | Tragic $37,083 |
| Immigrants | Belize | 0.4 /100 | #265 | Tragic $37,056 |
| Dominicans | 0.4 /100 | #266 | Tragic $37,046 |
| Immigrants | Nonimmigrants | 0.4 /100 | #267 | Tragic $37,024 |
| Cree | 0.4 /100 | #268 | Tragic $37,018 |
Demographics Similar to Immigrants from Guatemala by Median Female Earnings
In terms of median female earnings, the demographic groups most similar to Immigrants from Guatemala are Immigrants from Micronesia ($35,477, a difference of 0.090%), Hmong ($35,498, a difference of 0.15%), Yuman ($35,377, a difference of 0.19%), Pima ($35,326, a difference of 0.33%), and Black/African American ($35,315, a difference of 0.36%).
| Demographics | Rating | Rank | Median Female Earnings |
| Americans | 0.0 /100 | #292 | Tragic $35,777 |
| Guatemalans | 0.0 /100 | #293 | Tragic $35,695 |
| Cheyenne | 0.0 /100 | #294 | Tragic $35,673 |
| Comanche | 0.0 /100 | #295 | Tragic $35,661 |
| Mexican American Indians | 0.0 /100 | #296 | Tragic $35,629 |
| Hmong | 0.0 /100 | #297 | Tragic $35,498 |
| Immigrants | Micronesia | 0.0 /100 | #298 | Tragic $35,477 |
| Immigrants | Guatemala | 0.0 /100 | #299 | Tragic $35,444 |
| Yuman | 0.0 /100 | #300 | Tragic $35,377 |
| Pima | 0.0 /100 | #301 | Tragic $35,326 |
| Blacks/African Americans | 0.0 /100 | #302 | Tragic $35,315 |
| Immigrants | Latin America | 0.0 /100 | #303 | Tragic $35,307 |
| Crow | 0.0 /100 | #304 | Tragic $35,266 |
| Bahamians | 0.0 /100 | #305 | Tragic $35,125 |
| Fijians | 0.0 /100 | #306 | Tragic $35,114 |