Malaysian vs Cambodian Median Female Earnings
COMPARE
Malaysian
Cambodian
Median Female Earnings
Median Female Earnings Comparison
Malaysians
Cambodians
$37,298
MEDIAN FEMALE EARNINGS
0.7/ 100
METRIC RATING
261st/ 347
METRIC RANK
$45,014
MEDIAN FEMALE EARNINGS
100.0/ 100
METRIC RATING
21st/ 347
METRIC RANK
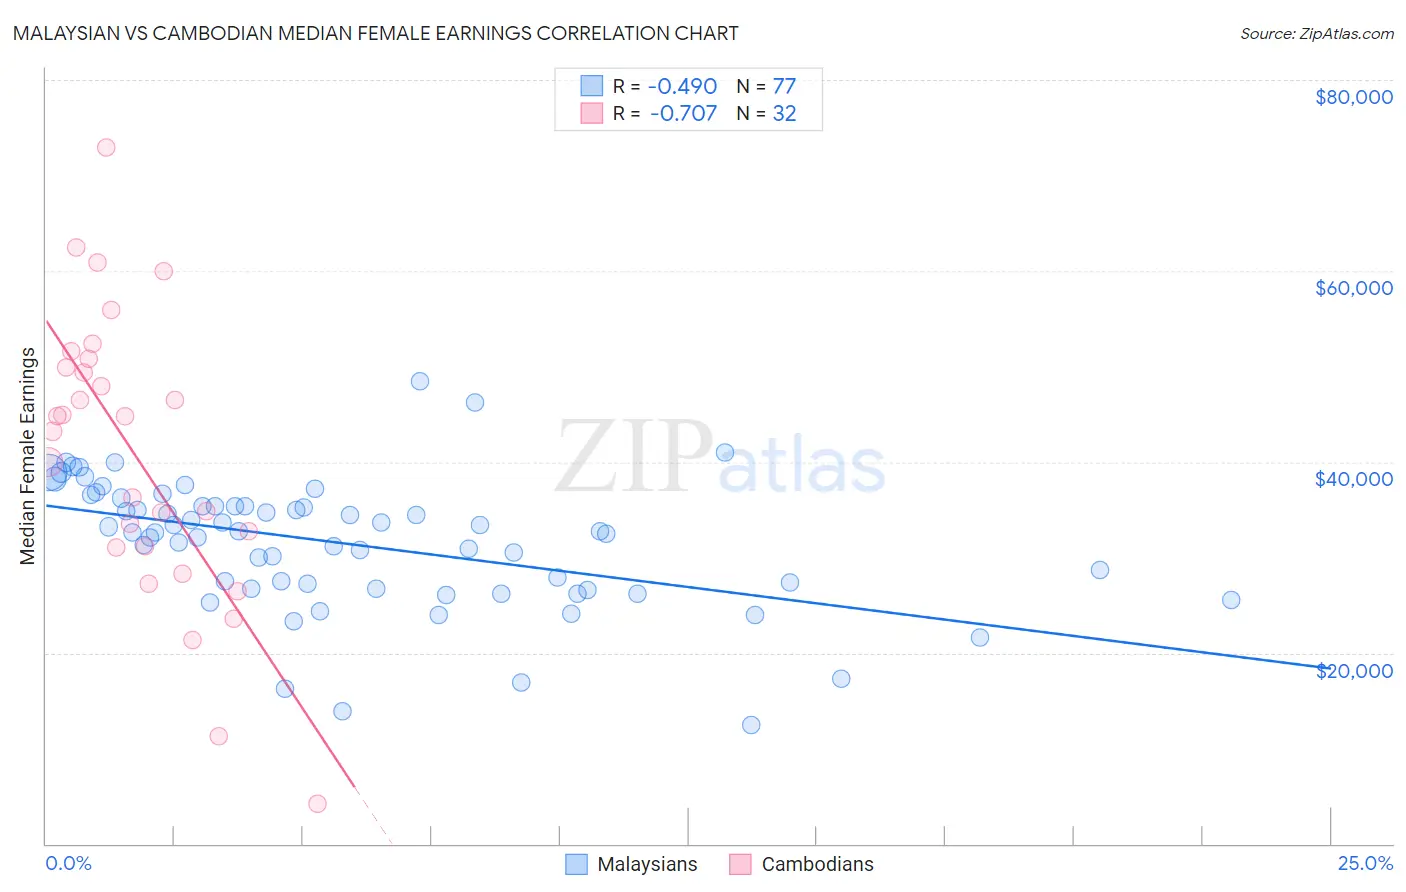
Malaysian vs Cambodian Median Female Earnings Correlation Chart
The statistical analysis conducted on geographies consisting of 226,078,777 people shows a moderate negative correlation between the proportion of Malaysians and median female earnings in the United States with a correlation coefficient (R) of -0.490 and weighted average of $37,298. Similarly, the statistical analysis conducted on geographies consisting of 102,513,966 people shows a strong negative correlation between the proportion of Cambodians and median female earnings in the United States with a correlation coefficient (R) of -0.707 and weighted average of $45,014, a difference of 20.7%.
Median Female Earnings Correlation Summary
| Measurement | Malaysian | Cambodian |
| Minimum | $12,451 | $4,132 |
| Maximum | $48,393 | $72,888 |
| Range | $35,942 | $68,756 |
| Mean | $31,448 | $40,669 |
| Median | $32,647 | $43,973 |
| Interquartile 25% (IQ1) | $26,696 | $31,093 |
| Interquartile 75% (IQ3) | $35,386 | $50,357 |
| Interquartile Range (IQR) | $8,690 | $19,265 |
| Standard Deviation (Sample) | $6,791 | $15,041 |
| Standard Deviation (Population) | $6,747 | $14,804 |
Similar Demographics by Median Female Earnings
Demographics Similar to Malaysians by Median Female Earnings
In terms of median female earnings, the demographic groups most similar to Malaysians are Venezuelan ($37,282, a difference of 0.040%), Dutch ($37,339, a difference of 0.11%), Scotch-Irish ($37,383, a difference of 0.23%), Belizean ($37,429, a difference of 0.35%), and German Russian ($37,105, a difference of 0.52%).
| Demographics | Rating | Rank | Median Female Earnings |
| Whites/Caucasians | 1.1 /100 | #254 | Tragic $37,531 |
| Colville | 1.1 /100 | #255 | Tragic $37,514 |
| Samoans | 1.0 /100 | #256 | Tragic $37,498 |
| Hawaiians | 1.0 /100 | #257 | Tragic $37,497 |
| Belizeans | 0.9 /100 | #258 | Tragic $37,429 |
| Scotch-Irish | 0.8 /100 | #259 | Tragic $37,383 |
| Dutch | 0.7 /100 | #260 | Tragic $37,339 |
| Malaysians | 0.7 /100 | #261 | Tragic $37,298 |
| Venezuelans | 0.7 /100 | #262 | Tragic $37,282 |
| German Russians | 0.5 /100 | #263 | Tragic $37,105 |
| Salvadorans | 0.4 /100 | #264 | Tragic $37,083 |
| Immigrants | Belize | 0.4 /100 | #265 | Tragic $37,056 |
| Dominicans | 0.4 /100 | #266 | Tragic $37,046 |
| Immigrants | Nonimmigrants | 0.4 /100 | #267 | Tragic $37,024 |
| Cree | 0.4 /100 | #268 | Tragic $37,018 |
Demographics Similar to Cambodians by Median Female Earnings
In terms of median female earnings, the demographic groups most similar to Cambodians are Immigrants from Greece ($44,976, a difference of 0.080%), Burmese ($44,911, a difference of 0.23%), Immigrants from Korea ($44,847, a difference of 0.37%), Immigrants from Sweden ($44,774, a difference of 0.54%), and Immigrants from Belarus ($44,757, a difference of 0.57%).
| Demographics | Rating | Rank | Median Female Earnings |
| Soviet Union | 100.0 /100 | #14 | Exceptional $46,556 |
| Immigrants | Eastern Asia | 100.0 /100 | #15 | Exceptional $46,502 |
| Indians (Asian) | 100.0 /100 | #16 | Exceptional $46,481 |
| Immigrants | South Central Asia | 100.0 /100 | #17 | Exceptional $46,324 |
| Cypriots | 100.0 /100 | #18 | Exceptional $45,570 |
| Eastern Europeans | 100.0 /100 | #19 | Exceptional $45,385 |
| Immigrants | Japan | 100.0 /100 | #20 | Exceptional $45,323 |
| Cambodians | 100.0 /100 | #21 | Exceptional $45,014 |
| Immigrants | Greece | 100.0 /100 | #22 | Exceptional $44,976 |
| Burmese | 100.0 /100 | #23 | Exceptional $44,911 |
| Immigrants | Korea | 100.0 /100 | #24 | Exceptional $44,847 |
| Immigrants | Sweden | 100.0 /100 | #25 | Exceptional $44,774 |
| Immigrants | Belarus | 100.0 /100 | #26 | Exceptional $44,757 |
| Turks | 100.0 /100 | #27 | Exceptional $44,695 |
| Immigrants | Russia | 100.0 /100 | #28 | Exceptional $44,680 |