Malaysian vs Immigrants from West Indies Median Female Earnings
COMPARE
Malaysian
Immigrants from West Indies
Median Female Earnings
Median Female Earnings Comparison
Malaysians
Immigrants from West Indies
$37,298
MEDIAN FEMALE EARNINGS
0.7/ 100
METRIC RATING
261st/ 347
METRIC RANK
$39,441
MEDIAN FEMALE EARNINGS
36.9/ 100
METRIC RATING
185th/ 347
METRIC RANK
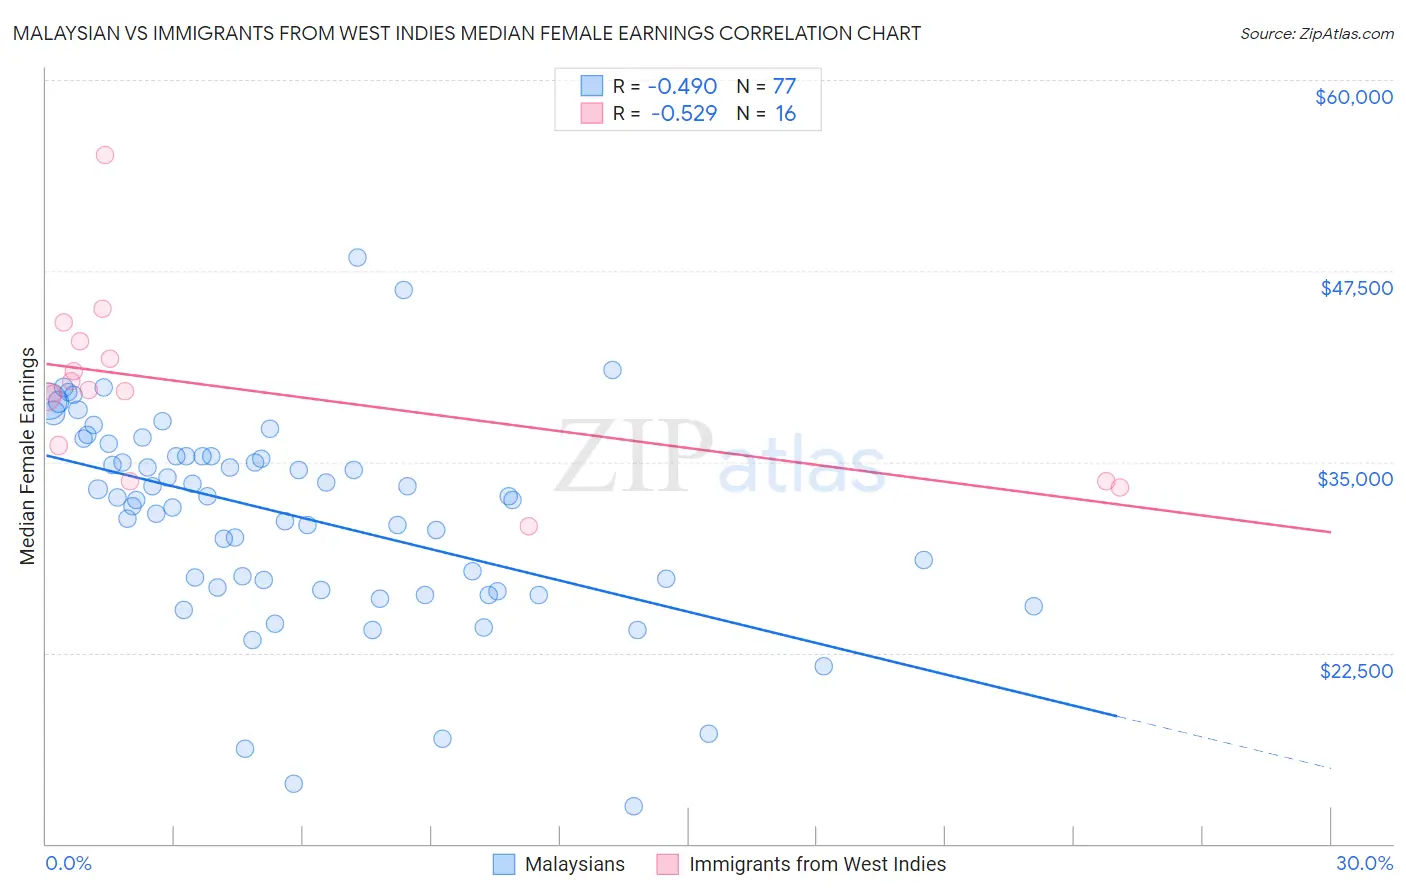
Malaysian vs Immigrants from West Indies Median Female Earnings Correlation Chart
The statistical analysis conducted on geographies consisting of 226,078,777 people shows a moderate negative correlation between the proportion of Malaysians and median female earnings in the United States with a correlation coefficient (R) of -0.490 and weighted average of $37,298. Similarly, the statistical analysis conducted on geographies consisting of 72,414,276 people shows a substantial negative correlation between the proportion of Immigrants from West Indies and median female earnings in the United States with a correlation coefficient (R) of -0.529 and weighted average of $39,441, a difference of 5.7%.
Median Female Earnings Correlation Summary
| Measurement | Malaysian | Immigrants from West Indies |
| Minimum | $12,451 | $30,781 |
| Maximum | $48,393 | $55,116 |
| Range | $35,942 | $24,335 |
| Mean | $31,448 | $39,738 |
| Median | $32,647 | $39,670 |
| Interquartile 25% (IQ1) | $26,696 | $34,901 |
| Interquartile 75% (IQ3) | $35,386 | $42,316 |
| Interquartile Range (IQR) | $8,690 | $7,415 |
| Standard Deviation (Sample) | $6,791 | $5,811 |
| Standard Deviation (Population) | $6,747 | $5,627 |
Similar Demographics by Median Female Earnings
Demographics Similar to Malaysians by Median Female Earnings
In terms of median female earnings, the demographic groups most similar to Malaysians are Venezuelan ($37,282, a difference of 0.040%), Dutch ($37,339, a difference of 0.11%), Scotch-Irish ($37,383, a difference of 0.23%), Belizean ($37,429, a difference of 0.35%), and German Russian ($37,105, a difference of 0.52%).
| Demographics | Rating | Rank | Median Female Earnings |
| Whites/Caucasians | 1.1 /100 | #254 | Tragic $37,531 |
| Colville | 1.1 /100 | #255 | Tragic $37,514 |
| Samoans | 1.0 /100 | #256 | Tragic $37,498 |
| Hawaiians | 1.0 /100 | #257 | Tragic $37,497 |
| Belizeans | 0.9 /100 | #258 | Tragic $37,429 |
| Scotch-Irish | 0.8 /100 | #259 | Tragic $37,383 |
| Dutch | 0.7 /100 | #260 | Tragic $37,339 |
| Malaysians | 0.7 /100 | #261 | Tragic $37,298 |
| Venezuelans | 0.7 /100 | #262 | Tragic $37,282 |
| German Russians | 0.5 /100 | #263 | Tragic $37,105 |
| Salvadorans | 0.4 /100 | #264 | Tragic $37,083 |
| Immigrants | Belize | 0.4 /100 | #265 | Tragic $37,056 |
| Dominicans | 0.4 /100 | #266 | Tragic $37,046 |
| Immigrants | Nonimmigrants | 0.4 /100 | #267 | Tragic $37,024 |
| Cree | 0.4 /100 | #268 | Tragic $37,018 |
Demographics Similar to Immigrants from West Indies by Median Female Earnings
In terms of median female earnings, the demographic groups most similar to Immigrants from West Indies are Colombian ($39,439, a difference of 0.0%), European ($39,457, a difference of 0.040%), Swedish ($39,421, a difference of 0.050%), Bermudan ($39,418, a difference of 0.060%), and Senegalese ($39,384, a difference of 0.14%).
| Demographics | Rating | Rank | Median Female Earnings |
| Slavs | 45.6 /100 | #178 | Average $39,613 |
| Immigrants | Germany | 45.1 /100 | #179 | Average $39,603 |
| Immigrants | Kenya | 41.6 /100 | #180 | Average $39,535 |
| Tsimshian | 41.4 /100 | #181 | Average $39,530 |
| Tlingit-Haida | 40.5 /100 | #182 | Average $39,513 |
| Hungarians | 40.3 /100 | #183 | Average $39,510 |
| Europeans | 37.7 /100 | #184 | Fair $39,457 |
| Immigrants | West Indies | 36.9 /100 | #185 | Fair $39,441 |
| Colombians | 36.9 /100 | #186 | Fair $39,439 |
| Swedes | 36.0 /100 | #187 | Fair $39,421 |
| Bermudans | 35.9 /100 | #188 | Fair $39,418 |
| Senegalese | 34.2 /100 | #189 | Fair $39,384 |
| Puget Sound Salish | 33.9 /100 | #190 | Fair $39,376 |
| Immigrants | Western Africa | 32.7 /100 | #191 | Fair $39,351 |
| Immigrants | Immigrants | 31.7 /100 | #192 | Fair $39,328 |