Malaysian vs Immigrants from Moldova Median Female Earnings
COMPARE
Malaysian
Immigrants from Moldova
Median Female Earnings
Median Female Earnings Comparison
Malaysians
Immigrants from Moldova
$37,298
MEDIAN FEMALE EARNINGS
0.7/ 100
METRIC RATING
261st/ 347
METRIC RANK
$42,304
MEDIAN FEMALE EARNINGS
99.6/ 100
METRIC RATING
80th/ 347
METRIC RANK
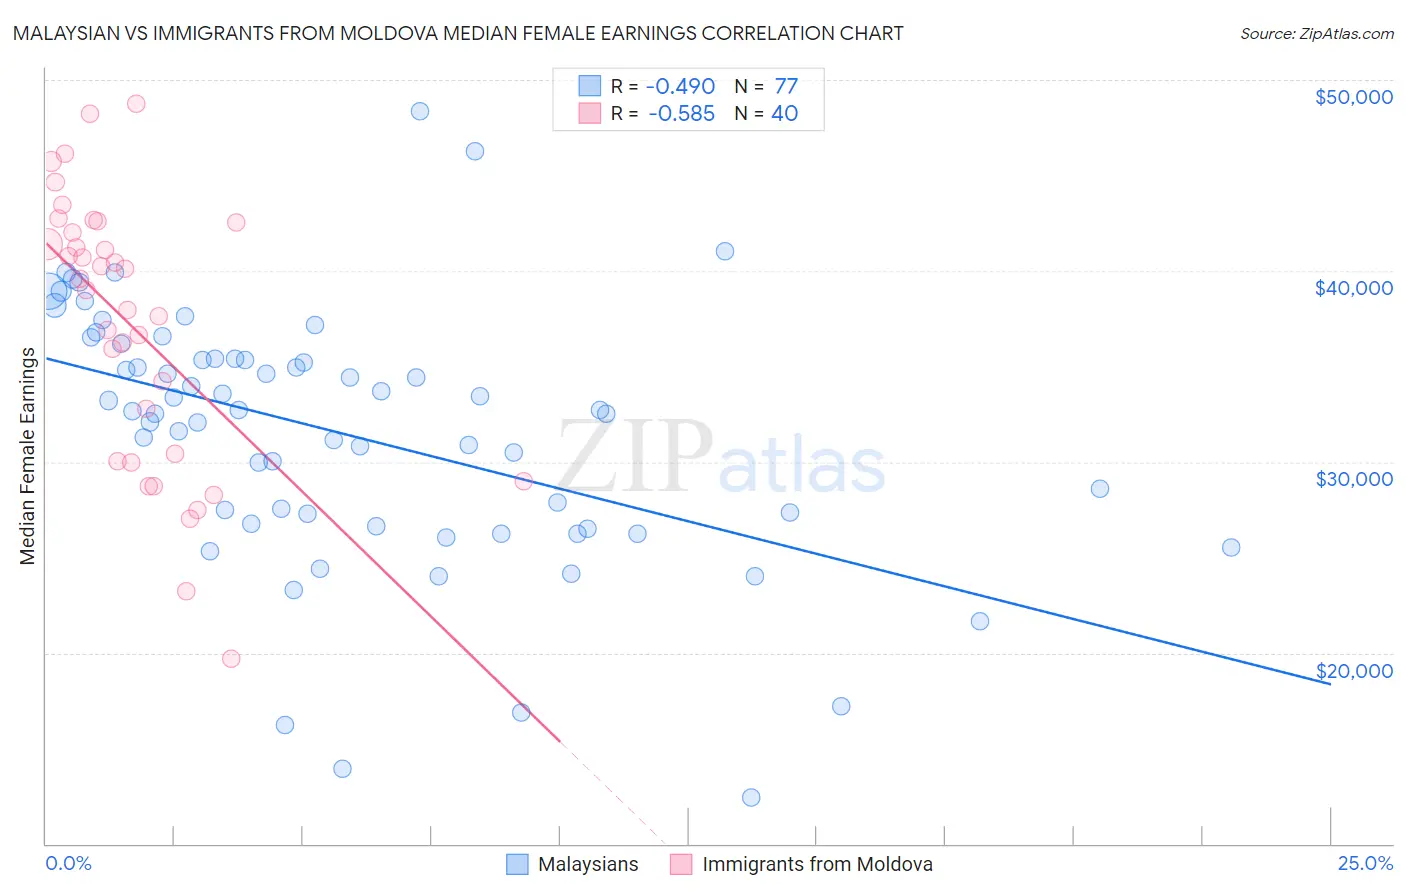
Malaysian vs Immigrants from Moldova Median Female Earnings Correlation Chart
The statistical analysis conducted on geographies consisting of 226,078,777 people shows a moderate negative correlation between the proportion of Malaysians and median female earnings in the United States with a correlation coefficient (R) of -0.490 and weighted average of $37,298. Similarly, the statistical analysis conducted on geographies consisting of 124,390,401 people shows a substantial negative correlation between the proportion of Immigrants from Moldova and median female earnings in the United States with a correlation coefficient (R) of -0.585 and weighted average of $42,304, a difference of 13.4%.
Median Female Earnings Correlation Summary
| Measurement | Malaysian | Immigrants from Moldova |
| Minimum | $12,451 | $19,712 |
| Maximum | $48,393 | $48,785 |
| Range | $35,942 | $29,073 |
| Mean | $31,448 | $37,125 |
| Median | $32,647 | $39,287 |
| Interquartile 25% (IQ1) | $26,696 | $30,213 |
| Interquartile 75% (IQ3) | $35,386 | $42,291 |
| Interquartile Range (IQR) | $8,690 | $12,078 |
| Standard Deviation (Sample) | $6,791 | $7,033 |
| Standard Deviation (Population) | $6,747 | $6,945 |
Similar Demographics by Median Female Earnings
Demographics Similar to Malaysians by Median Female Earnings
In terms of median female earnings, the demographic groups most similar to Malaysians are Venezuelan ($37,282, a difference of 0.040%), Dutch ($37,339, a difference of 0.11%), Scotch-Irish ($37,383, a difference of 0.23%), Belizean ($37,429, a difference of 0.35%), and German Russian ($37,105, a difference of 0.52%).
| Demographics | Rating | Rank | Median Female Earnings |
| Whites/Caucasians | 1.1 /100 | #254 | Tragic $37,531 |
| Colville | 1.1 /100 | #255 | Tragic $37,514 |
| Samoans | 1.0 /100 | #256 | Tragic $37,498 |
| Hawaiians | 1.0 /100 | #257 | Tragic $37,497 |
| Belizeans | 0.9 /100 | #258 | Tragic $37,429 |
| Scotch-Irish | 0.8 /100 | #259 | Tragic $37,383 |
| Dutch | 0.7 /100 | #260 | Tragic $37,339 |
| Malaysians | 0.7 /100 | #261 | Tragic $37,298 |
| Venezuelans | 0.7 /100 | #262 | Tragic $37,282 |
| German Russians | 0.5 /100 | #263 | Tragic $37,105 |
| Salvadorans | 0.4 /100 | #264 | Tragic $37,083 |
| Immigrants | Belize | 0.4 /100 | #265 | Tragic $37,056 |
| Dominicans | 0.4 /100 | #266 | Tragic $37,046 |
| Immigrants | Nonimmigrants | 0.4 /100 | #267 | Tragic $37,024 |
| Cree | 0.4 /100 | #268 | Tragic $37,018 |
Demographics Similar to Immigrants from Moldova by Median Female Earnings
In terms of median female earnings, the demographic groups most similar to Immigrants from Moldova are Immigrants from Southern Europe ($42,275, a difference of 0.070%), Greek ($42,336, a difference of 0.080%), Immigrants from Morocco ($42,229, a difference of 0.18%), Immigrants from Kazakhstan ($42,386, a difference of 0.19%), and Immigrants from Albania ($42,388, a difference of 0.20%).
| Demographics | Rating | Rank | Median Female Earnings |
| Mongolians | 99.7 /100 | #73 | Exceptional $42,542 |
| Immigrants | South Africa | 99.7 /100 | #74 | Exceptional $42,508 |
| New Zealanders | 99.7 /100 | #75 | Exceptional $42,446 |
| Immigrants | Italy | 99.7 /100 | #76 | Exceptional $42,446 |
| Immigrants | Albania | 99.6 /100 | #77 | Exceptional $42,388 |
| Immigrants | Kazakhstan | 99.6 /100 | #78 | Exceptional $42,386 |
| Greeks | 99.6 /100 | #79 | Exceptional $42,336 |
| Immigrants | Moldova | 99.6 /100 | #80 | Exceptional $42,304 |
| Immigrants | Southern Europe | 99.5 /100 | #81 | Exceptional $42,275 |
| Immigrants | Morocco | 99.5 /100 | #82 | Exceptional $42,229 |
| Immigrants | Sierra Leone | 99.5 /100 | #83 | Exceptional $42,214 |
| Armenians | 99.5 /100 | #84 | Exceptional $42,212 |
| Laotians | 99.4 /100 | #85 | Exceptional $42,133 |
| Immigrants | St. Vincent and the Grenadines | 99.3 /100 | #86 | Exceptional $42,108 |
| Lithuanians | 99.3 /100 | #87 | Exceptional $42,108 |