Immigrants from Scotland vs Sri Lankan Wage/Income Gap
COMPARE
Immigrants from Scotland
Sri Lankan
Wage/Income Gap
Wage/Income Gap Comparison
Immigrants from Scotland
Sri Lankans
28.7%
WAGE/INCOME GAP
0.1/ 100
METRIC RATING
314th/ 347
METRIC RANK
25.8%
WAGE/INCOME GAP
47.0/ 100
METRIC RATING
175th/ 347
METRIC RANK
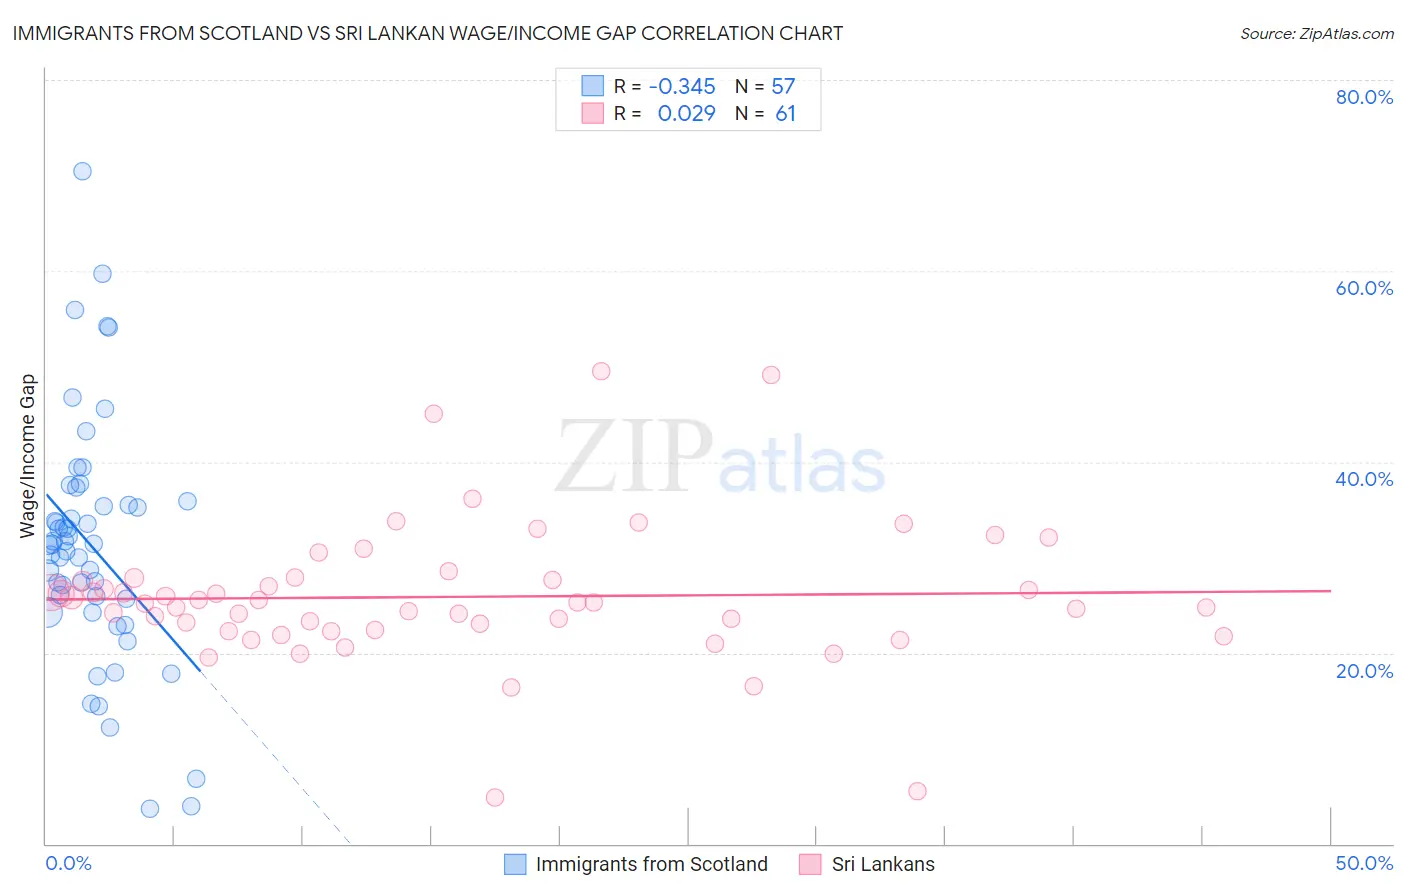
Immigrants from Scotland vs Sri Lankan Wage/Income Gap Correlation Chart
The statistical analysis conducted on geographies consisting of 196,317,574 people shows a mild negative correlation between the proportion of Immigrants from Scotland and wage/income gap percentage in the United States with a correlation coefficient (R) of -0.345 and weighted average of 28.7%. Similarly, the statistical analysis conducted on geographies consisting of 440,345,816 people shows no correlation between the proportion of Sri Lankans and wage/income gap percentage in the United States with a correlation coefficient (R) of 0.029 and weighted average of 25.8%, a difference of 11.3%.
Wage/Income Gap Correlation Summary
| Measurement | Immigrants from Scotland | Sri Lankan |
| Minimum | 3.7% | 4.9% |
| Maximum | 70.5% | 49.5% |
| Range | 66.8% | 44.7% |
| Mean | 31.2% | 25.9% |
| Median | 31.4% | 25.2% |
| Interquartile 25% (IQ1) | 24.9% | 22.3% |
| Interquartile 75% (IQ3) | 35.7% | 27.8% |
| Interquartile Range (IQR) | 10.7% | 5.4% |
| Standard Deviation (Sample) | 12.7% | 7.4% |
| Standard Deviation (Population) | 12.6% | 7.4% |
Similar Demographics by Wage/Income Gap
Demographics Similar to Immigrants from Scotland by Wage/Income Gap
In terms of wage/income gap, the demographic groups most similar to Immigrants from Scotland are Maltese (28.7%, a difference of 0.050%), Lithuanian (28.7%, a difference of 0.060%), French (28.7%, a difference of 0.15%), Belgian (28.8%, a difference of 0.17%), and Basque (28.8%, a difference of 0.22%).
| Demographics | Rating | Rank | Wage/Income Gap |
| Immigrants | Denmark | 0.1 /100 | #307 | Tragic 28.5% |
| Poles | 0.1 /100 | #308 | Tragic 28.5% |
| Macedonians | 0.1 /100 | #309 | Tragic 28.6% |
| Finns | 0.1 /100 | #310 | Tragic 28.6% |
| Immigrants | Lithuania | 0.1 /100 | #311 | Tragic 28.6% |
| Eastern Europeans | 0.1 /100 | #312 | Tragic 28.6% |
| French | 0.1 /100 | #313 | Tragic 28.7% |
| Immigrants | Scotland | 0.1 /100 | #314 | Tragic 28.7% |
| Maltese | 0.1 /100 | #315 | Tragic 28.7% |
| Lithuanians | 0.1 /100 | #316 | Tragic 28.7% |
| Belgians | 0.1 /100 | #317 | Tragic 28.8% |
| Basques | 0.1 /100 | #318 | Tragic 28.8% |
| Slovaks | 0.1 /100 | #319 | Tragic 28.9% |
| British | 0.1 /100 | #320 | Tragic 28.9% |
| Welsh | 0.1 /100 | #321 | Tragic 28.9% |
Demographics Similar to Sri Lankans by Wage/Income Gap
In terms of wage/income gap, the demographic groups most similar to Sri Lankans are Paraguayan (25.8%, a difference of 0.020%), Cambodian (25.8%, a difference of 0.12%), Alaskan Athabascan (25.8%, a difference of 0.20%), Chinese (25.9%, a difference of 0.33%), and Immigrants from Belarus (25.7%, a difference of 0.39%).
| Demographics | Rating | Rank | Wage/Income Gap |
| Seminole | 62.6 /100 | #168 | Good 25.6% |
| Peruvians | 60.1 /100 | #169 | Good 25.6% |
| Immigrants | Oceania | 57.5 /100 | #170 | Average 25.6% |
| Immigrants | Greece | 56.6 /100 | #171 | Average 25.7% |
| Immigrants | Chile | 53.2 /100 | #172 | Average 25.7% |
| Immigrants | Belarus | 52.9 /100 | #173 | Average 25.7% |
| Alaskan Athabascans | 50.0 /100 | #174 | Average 25.8% |
| Sri Lankans | 47.0 /100 | #175 | Average 25.8% |
| Paraguayans | 46.7 /100 | #176 | Average 25.8% |
| Cambodians | 45.1 /100 | #177 | Average 25.8% |
| Chinese | 42.0 /100 | #178 | Average 25.9% |
| Samoans | 38.6 /100 | #179 | Fair 26.0% |
| Guamanians/Chamorros | 38.0 /100 | #180 | Fair 26.0% |
| Immigrants | Bolivia | 36.4 /100 | #181 | Fair 26.0% |
| Immigrants | Serbia | 35.4 /100 | #182 | Fair 26.0% |