Liberian vs Apache In Labor Force | Age > 16
COMPARE
Liberian
Apache
In Labor Force | Age > 16
In Labor Force | Age > 16 Comparison
Liberians
Apache
67.8%
IN LABOR FORCE | AGE > 16
100.0/ 100
METRIC RATING
14th/ 347
METRIC RANK
60.7%
IN LABOR FORCE | AGE > 16
0.0/ 100
METRIC RATING
334th/ 347
METRIC RANK
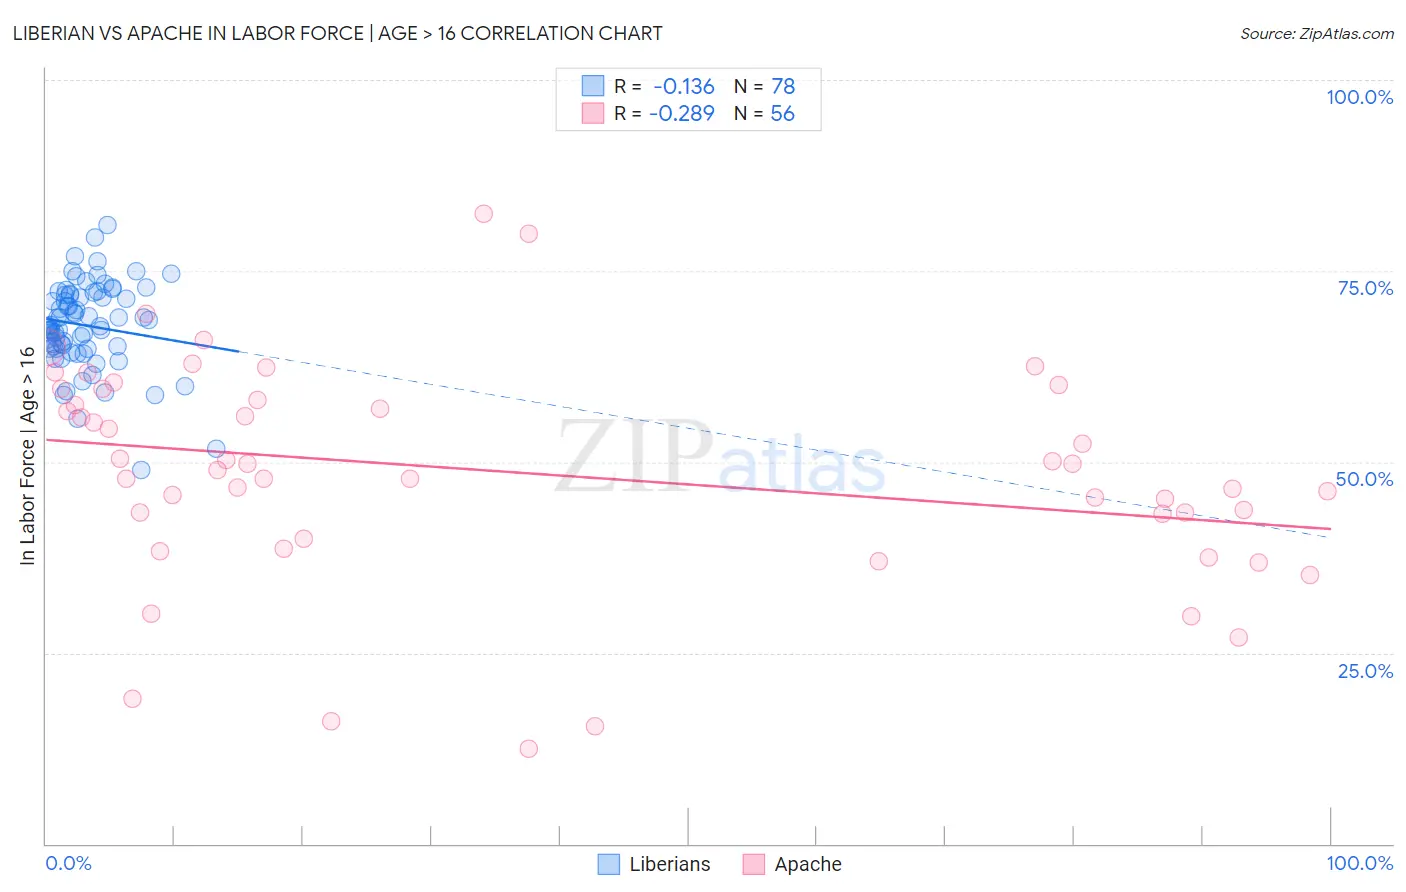
Liberian vs Apache In Labor Force | Age > 16 Correlation Chart
The statistical analysis conducted on geographies consisting of 118,097,222 people shows a poor negative correlation between the proportion of Liberians and labor force participation rate among population ages 16 and over in the United States with a correlation coefficient (R) of -0.136 and weighted average of 67.8%. Similarly, the statistical analysis conducted on geographies consisting of 231,124,853 people shows a weak negative correlation between the proportion of Apache and labor force participation rate among population ages 16 and over in the United States with a correlation coefficient (R) of -0.289 and weighted average of 60.7%, a difference of 11.7%.
In Labor Force | Age > 16 Correlation Summary
| Measurement | Liberian | Apache |
| Minimum | 49.0% | 12.5% |
| Maximum | 81.0% | 82.5% |
| Range | 32.0% | 70.0% |
| Mean | 67.9% | 48.6% |
| Median | 67.8% | 49.3% |
| Interquartile 25% (IQ1) | 64.8% | 41.6% |
| Interquartile 75% (IQ3) | 71.9% | 58.8% |
| Interquartile Range (IQR) | 7.1% | 17.2% |
| Standard Deviation (Sample) | 5.7% | 14.5% |
| Standard Deviation (Population) | 5.6% | 14.4% |
Similar Demographics by In Labor Force | Age > 16
Demographics Similar to Liberians by In Labor Force | Age > 16
In terms of in labor force | age > 16, the demographic groups most similar to Liberians are Immigrants from Middle Africa (67.7%, a difference of 0.050%), Immigrants from Sudan (67.7%, a difference of 0.16%), Immigrants from India (67.6%, a difference of 0.24%), Immigrants from Liberia (67.6%, a difference of 0.25%), and Kenyan (67.6%, a difference of 0.29%).
| Demographics | Rating | Rank | In Labor Force | Age > 16 |
| Immigrants | Cameroon | 100.0 /100 | #7 | Exceptional 68.7% |
| Immigrants | Sierra Leone | 100.0 /100 | #8 | Exceptional 68.5% |
| Immigrants | Eastern Africa | 100.0 /100 | #9 | Exceptional 68.5% |
| Immigrants | Bolivia | 100.0 /100 | #10 | Exceptional 68.4% |
| Bolivians | 100.0 /100 | #11 | Exceptional 68.2% |
| Sudanese | 100.0 /100 | #12 | Exceptional 68.0% |
| Immigrants | Nepal | 100.0 /100 | #13 | Exceptional 68.0% |
| Liberians | 100.0 /100 | #14 | Exceptional 67.8% |
| Immigrants | Middle Africa | 100.0 /100 | #15 | Exceptional 67.7% |
| Immigrants | Sudan | 100.0 /100 | #16 | Exceptional 67.7% |
| Immigrants | India | 100.0 /100 | #17 | Exceptional 67.6% |
| Immigrants | Liberia | 100.0 /100 | #18 | Exceptional 67.6% |
| Kenyans | 100.0 /100 | #19 | Exceptional 67.6% |
| Immigrants | Kenya | 100.0 /100 | #20 | Exceptional 67.6% |
| Tongans | 100.0 /100 | #21 | Exceptional 67.5% |
Demographics Similar to Apache by In Labor Force | Age > 16
In terms of in labor force | age > 16, the demographic groups most similar to Apache are Paiute (60.7%, a difference of 0.050%), Crow (60.8%, a difference of 0.13%), Native/Alaskan (60.6%, a difference of 0.19%), Menominee (60.6%, a difference of 0.21%), and Ute (60.9%, a difference of 0.30%).
| Demographics | Rating | Rank | In Labor Force | Age > 16 |
| Cajuns | 0.0 /100 | #327 | Tragic 61.8% |
| Dutch West Indians | 0.0 /100 | #328 | Tragic 61.7% |
| Choctaw | 0.0 /100 | #329 | Tragic 61.5% |
| Creek | 0.0 /100 | #330 | Tragic 61.3% |
| Ute | 0.0 /100 | #331 | Tragic 60.9% |
| Crow | 0.0 /100 | #332 | Tragic 60.8% |
| Paiute | 0.0 /100 | #333 | Tragic 60.7% |
| Apache | 0.0 /100 | #334 | Tragic 60.7% |
| Natives/Alaskans | 0.0 /100 | #335 | Tragic 60.6% |
| Menominee | 0.0 /100 | #336 | Tragic 60.6% |
| Colville | 0.0 /100 | #337 | Tragic 59.8% |
| Immigrants | Yemen | 0.0 /100 | #338 | Tragic 59.6% |
| Houma | 0.0 /100 | #339 | Tragic 59.5% |
| Pueblo | 0.0 /100 | #340 | Tragic 59.3% |
| Hopi | 0.0 /100 | #341 | Tragic 58.4% |