Italian vs Immigrants from Western Asia Median Male Earnings
COMPARE
Italian
Immigrants from Western Asia
Median Male Earnings
Median Male Earnings Comparison
Italians
Immigrants from Western Asia
$59,551
MEDIAN MALE EARNINGS
99.3/ 100
METRIC RATING
85th/ 347
METRIC RANK
$58,131
MEDIAN MALE EARNINGS
97.3/ 100
METRIC RATING
105th/ 347
METRIC RANK
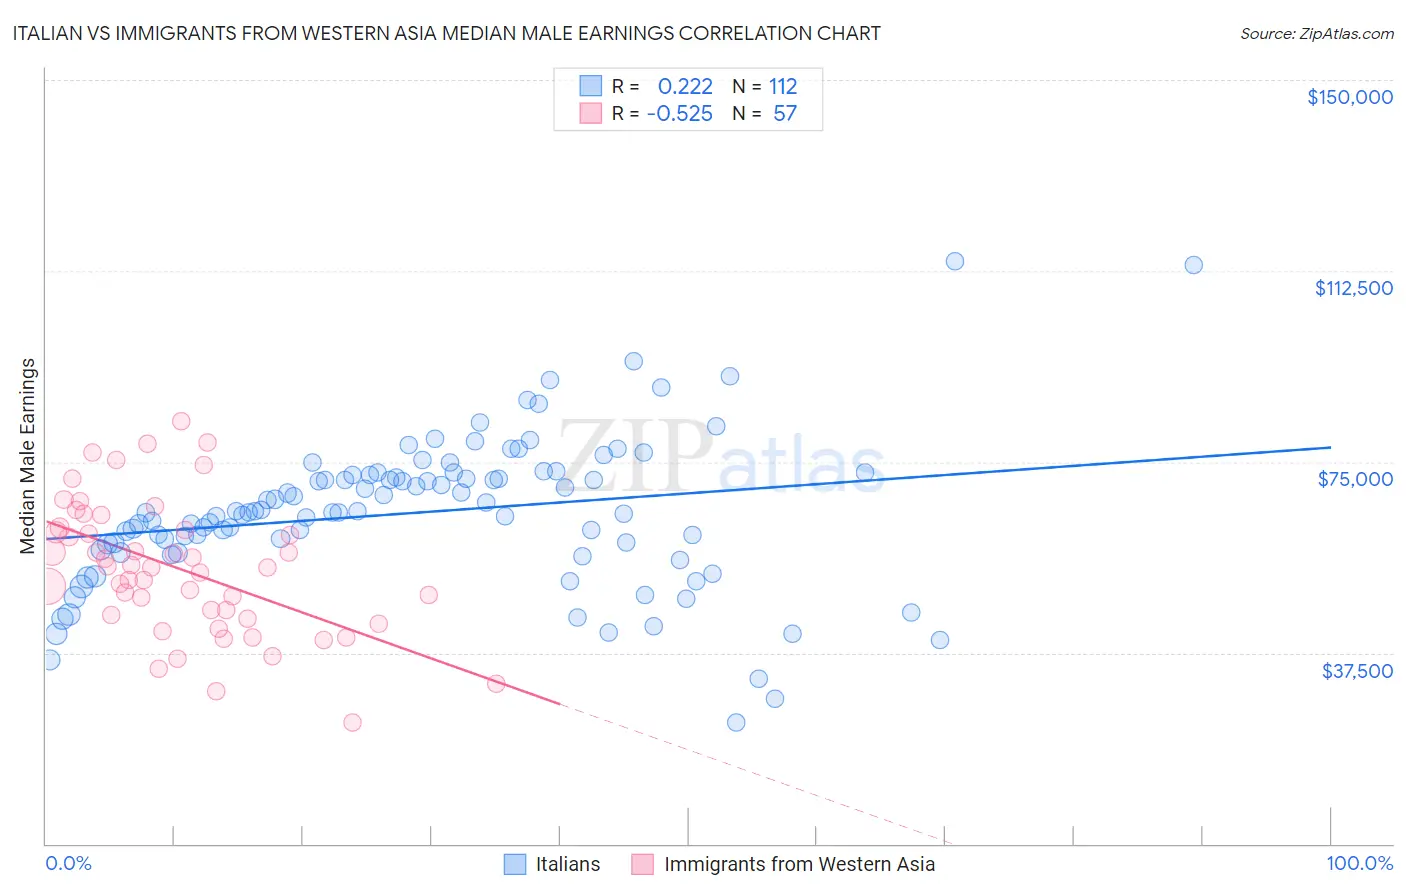
Italian vs Immigrants from Western Asia Median Male Earnings Correlation Chart
The statistical analysis conducted on geographies consisting of 573,649,793 people shows a weak positive correlation between the proportion of Italians and median male earnings in the United States with a correlation coefficient (R) of 0.222 and weighted average of $59,551. Similarly, the statistical analysis conducted on geographies consisting of 404,325,600 people shows a substantial negative correlation between the proportion of Immigrants from Western Asia and median male earnings in the United States with a correlation coefficient (R) of -0.525 and weighted average of $58,131, a difference of 2.4%.
Median Male Earnings Correlation Summary
| Measurement | Italian | Immigrants from Western Asia |
| Minimum | $23,704 | $23,930 |
| Maximum | $114,356 | $82,862 |
| Range | $90,652 | $58,932 |
| Mean | $65,064 | $54,093 |
| Median | $65,149 | $54,361 |
| Interquartile 25% (IQ1) | $58,270 | $44,525 |
| Interquartile 75% (IQ3) | $72,487 | $61,864 |
| Interquartile Range (IQR) | $14,217 | $17,339 |
| Standard Deviation (Sample) | $14,744 | $13,096 |
| Standard Deviation (Population) | $14,679 | $12,981 |
Demographics Similar to Italians and Immigrants from Western Asia by Median Male Earnings
In terms of median male earnings, the demographic groups most similar to Italians are Immigrants from England ($59,527, a difference of 0.040%), Macedonian ($59,522, a difference of 0.050%), Immigrants from Argentina ($59,491, a difference of 0.10%), Immigrants from Moldova ($59,417, a difference of 0.23%), and Austrian ($59,359, a difference of 0.32%). Similarly, the demographic groups most similar to Immigrants from Western Asia are Armenian ($58,134, a difference of 0.010%), Polish ($58,139, a difference of 0.020%), Syrian ($58,187, a difference of 0.10%), Immigrants from Brazil ($58,324, a difference of 0.33%), and Assyrian/Chaldean/Syriac ($58,437, a difference of 0.53%).
| Demographics | Rating | Rank | Median Male Earnings |
| Italians | 99.3 /100 | #85 | Exceptional $59,551 |
| Immigrants | England | 99.3 /100 | #86 | Exceptional $59,527 |
| Macedonians | 99.3 /100 | #87 | Exceptional $59,522 |
| Immigrants | Argentina | 99.3 /100 | #88 | Exceptional $59,491 |
| Immigrants | Moldova | 99.2 /100 | #89 | Exceptional $59,417 |
| Austrians | 99.2 /100 | #90 | Exceptional $59,359 |
| Laotians | 99.2 /100 | #91 | Exceptional $59,351 |
| Immigrants | Kazakhstan | 99.1 /100 | #92 | Exceptional $59,278 |
| Immigrants | Southern Europe | 99.0 /100 | #93 | Exceptional $59,217 |
| Immigrants | North Macedonia | 99.0 /100 | #94 | Exceptional $59,189 |
| Immigrants | Lebanon | 98.6 /100 | #95 | Exceptional $58,835 |
| Albanians | 98.4 /100 | #96 | Exceptional $58,680 |
| Northern Europeans | 98.2 /100 | #97 | Exceptional $58,588 |
| Jordanians | 98.1 /100 | #98 | Exceptional $58,500 |
| Immigrants | Poland | 98.0 /100 | #99 | Exceptional $58,452 |
| Assyrians/Chaldeans/Syriacs | 97.9 /100 | #100 | Exceptional $58,437 |
| Immigrants | Brazil | 97.7 /100 | #101 | Exceptional $58,324 |
| Syrians | 97.4 /100 | #102 | Exceptional $58,187 |
| Poles | 97.3 /100 | #103 | Exceptional $58,139 |
| Armenians | 97.3 /100 | #104 | Exceptional $58,134 |
| Immigrants | Western Asia | 97.3 /100 | #105 | Exceptional $58,131 |