Bhutanese vs Immigrants from Western Asia Median Male Earnings
COMPARE
Bhutanese
Immigrants from Western Asia
Median Male Earnings
Median Male Earnings Comparison
Bhutanese
Immigrants from Western Asia
$61,759
MEDIAN MALE EARNINGS
99.9/ 100
METRIC RATING
50th/ 347
METRIC RANK
$58,131
MEDIAN MALE EARNINGS
97.3/ 100
METRIC RATING
105th/ 347
METRIC RANK
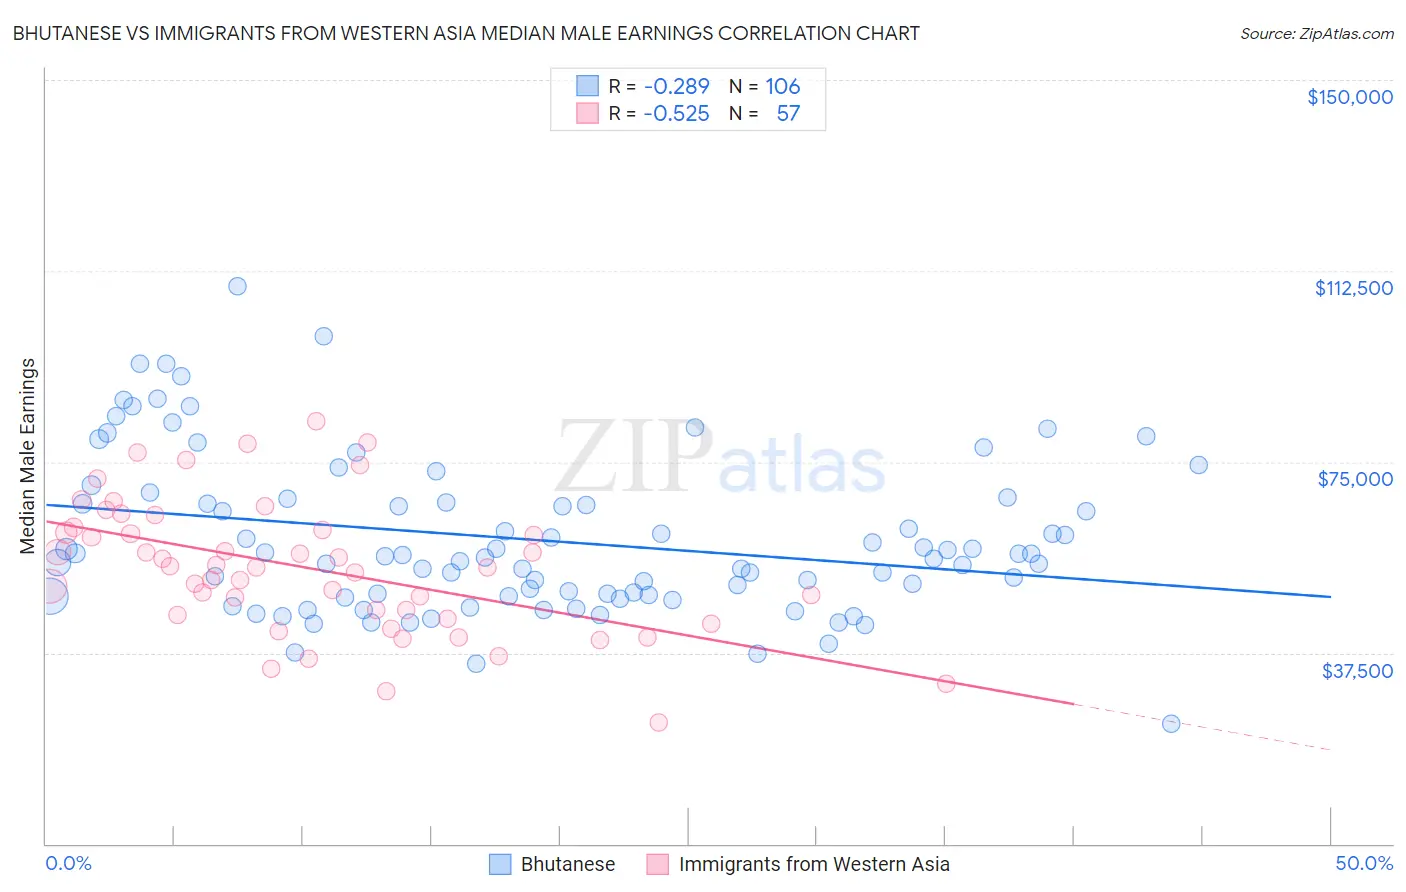
Bhutanese vs Immigrants from Western Asia Median Male Earnings Correlation Chart
The statistical analysis conducted on geographies consisting of 455,387,679 people shows a weak negative correlation between the proportion of Bhutanese and median male earnings in the United States with a correlation coefficient (R) of -0.289 and weighted average of $61,759. Similarly, the statistical analysis conducted on geographies consisting of 404,325,600 people shows a substantial negative correlation between the proportion of Immigrants from Western Asia and median male earnings in the United States with a correlation coefficient (R) of -0.525 and weighted average of $58,131, a difference of 6.2%.
Median Male Earnings Correlation Summary
| Measurement | Bhutanese | Immigrants from Western Asia |
| Minimum | $23,594 | $23,930 |
| Maximum | $109,392 | $82,862 |
| Range | $85,798 | $58,932 |
| Mean | $59,697 | $54,093 |
| Median | $56,402 | $54,361 |
| Interquartile 25% (IQ1) | $48,730 | $44,525 |
| Interquartile 75% (IQ3) | $67,058 | $61,864 |
| Interquartile Range (IQR) | $18,327 | $17,339 |
| Standard Deviation (Sample) | $15,498 | $13,096 |
| Standard Deviation (Population) | $15,425 | $12,981 |
Similar Demographics by Median Male Earnings
Demographics Similar to Bhutanese by Median Male Earnings
In terms of median male earnings, the demographic groups most similar to Bhutanese are Estonian ($61,710, a difference of 0.080%), Immigrants from Norway ($61,628, a difference of 0.21%), Immigrants from Europe ($62,057, a difference of 0.48%), South African ($61,460, a difference of 0.49%), and Immigrants from Latvia ($61,422, a difference of 0.55%).
| Demographics | Rating | Rank | Median Male Earnings |
| Immigrants | Belarus | 100.0 /100 | #43 | Exceptional $62,658 |
| Cambodians | 100.0 /100 | #44 | Exceptional $62,516 |
| Bulgarians | 100.0 /100 | #45 | Exceptional $62,378 |
| Immigrants | Czechoslovakia | 99.9 /100 | #46 | Exceptional $62,217 |
| Immigrants | Austria | 99.9 /100 | #47 | Exceptional $62,164 |
| Immigrants | Malaysia | 99.9 /100 | #48 | Exceptional $62,121 |
| Immigrants | Europe | 99.9 /100 | #49 | Exceptional $62,057 |
| Bhutanese | 99.9 /100 | #50 | Exceptional $61,759 |
| Estonians | 99.9 /100 | #51 | Exceptional $61,710 |
| Immigrants | Norway | 99.9 /100 | #52 | Exceptional $61,628 |
| South Africans | 99.9 /100 | #53 | Exceptional $61,460 |
| Immigrants | Latvia | 99.9 /100 | #54 | Exceptional $61,422 |
| Greeks | 99.9 /100 | #55 | Exceptional $61,242 |
| Lithuanians | 99.9 /100 | #56 | Exceptional $61,228 |
| Immigrants | Scotland | 99.9 /100 | #57 | Exceptional $61,220 |
Demographics Similar to Immigrants from Western Asia by Median Male Earnings
In terms of median male earnings, the demographic groups most similar to Immigrants from Western Asia are Armenian ($58,134, a difference of 0.010%), Polish ($58,139, a difference of 0.020%), Syrian ($58,187, a difference of 0.10%), Immigrants from Northern Africa ($58,008, a difference of 0.21%), and Serbian ($57,975, a difference of 0.27%).
| Demographics | Rating | Rank | Median Male Earnings |
| Jordanians | 98.1 /100 | #98 | Exceptional $58,500 |
| Immigrants | Poland | 98.0 /100 | #99 | Exceptional $58,452 |
| Assyrians/Chaldeans/Syriacs | 97.9 /100 | #100 | Exceptional $58,437 |
| Immigrants | Brazil | 97.7 /100 | #101 | Exceptional $58,324 |
| Syrians | 97.4 /100 | #102 | Exceptional $58,187 |
| Poles | 97.3 /100 | #103 | Exceptional $58,139 |
| Armenians | 97.3 /100 | #104 | Exceptional $58,134 |
| Immigrants | Western Asia | 97.3 /100 | #105 | Exceptional $58,131 |
| Immigrants | Northern Africa | 96.9 /100 | #106 | Exceptional $58,008 |
| Serbians | 96.8 /100 | #107 | Exceptional $57,975 |
| Immigrants | Uzbekistan | 96.7 /100 | #108 | Exceptional $57,941 |
| British | 96.5 /100 | #109 | Exceptional $57,890 |
| Palestinians | 96.2 /100 | #110 | Exceptional $57,778 |
| Europeans | 95.6 /100 | #111 | Exceptional $57,637 |
| Immigrants | Afghanistan | 95.4 /100 | #112 | Exceptional $57,582 |