Lebanese vs Czech Per Capita Income
COMPARE
Lebanese
Czech
Per Capita Income
Per Capita Income Comparison
Lebanese
Czechs
$45,840
PER CAPITA INCOME
92.0/ 100
METRIC RATING
123rd/ 347
METRIC RANK
$44,595
PER CAPITA INCOME
74.1/ 100
METRIC RATING
147th/ 347
METRIC RANK
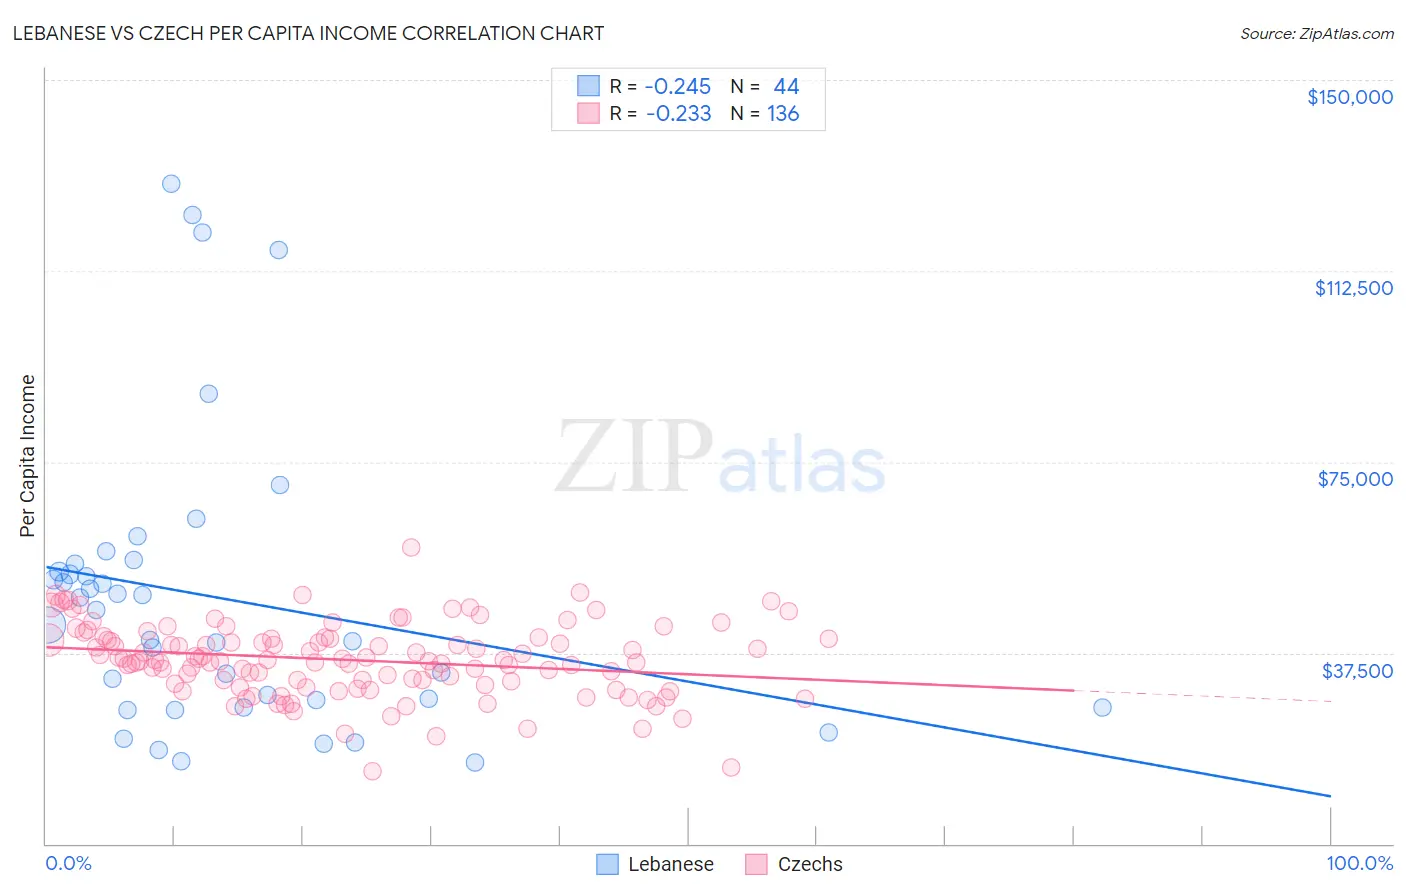
Lebanese vs Czech Per Capita Income Correlation Chart
The statistical analysis conducted on geographies consisting of 401,645,404 people shows a weak negative correlation between the proportion of Lebanese and per capita income in the United States with a correlation coefficient (R) of -0.245 and weighted average of $45,840. Similarly, the statistical analysis conducted on geographies consisting of 484,845,584 people shows a weak negative correlation between the proportion of Czechs and per capita income in the United States with a correlation coefficient (R) of -0.233 and weighted average of $44,595, a difference of 2.8%.
Per Capita Income Correlation Summary
| Measurement | Lebanese | Czech |
| Minimum | $15,839 | $14,339 |
| Maximum | $129,581 | $58,093 |
| Range | $113,742 | $43,754 |
| Mean | $48,201 | $36,126 |
| Median | $44,395 | $36,098 |
| Interquartile 25% (IQ1) | $27,415 | $31,633 |
| Interquartile 75% (IQ3) | $54,286 | $40,288 |
| Interquartile Range (IQR) | $26,871 | $8,655 |
| Standard Deviation (Sample) | $28,531 | $7,126 |
| Standard Deviation (Population) | $28,205 | $7,100 |
Similar Demographics by Per Capita Income
Demographics Similar to Lebanese by Per Capita Income
In terms of per capita income, the demographic groups most similar to Lebanese are European ($45,836, a difference of 0.010%), Moroccan ($45,854, a difference of 0.030%), Canadian ($45,858, a difference of 0.040%), Zimbabwean ($45,804, a difference of 0.080%), and Palestinian ($45,790, a difference of 0.11%).
| Demographics | Rating | Rank | Per Capita Income |
| Poles | 94.1 /100 | #116 | Exceptional $46,123 |
| Chinese | 93.9 /100 | #117 | Exceptional $46,098 |
| Immigrants | Saudi Arabia | 93.3 /100 | #118 | Exceptional $46,008 |
| Immigrants | Poland | 93.1 /100 | #119 | Exceptional $45,979 |
| Immigrants | Ethiopia | 92.7 /100 | #120 | Exceptional $45,923 |
| Canadians | 92.2 /100 | #121 | Exceptional $45,858 |
| Moroccans | 92.1 /100 | #122 | Exceptional $45,854 |
| Lebanese | 92.0 /100 | #123 | Exceptional $45,840 |
| Europeans | 92.0 /100 | #124 | Exceptional $45,836 |
| Zimbabweans | 91.7 /100 | #125 | Exceptional $45,804 |
| Palestinians | 91.6 /100 | #126 | Exceptional $45,790 |
| Immigrants | Germany | 91.3 /100 | #127 | Exceptional $45,751 |
| Swedes | 91.3 /100 | #128 | Exceptional $45,750 |
| Luxembourgers | 90.4 /100 | #129 | Exceptional $45,663 |
| Arabs | 90.4 /100 | #130 | Exceptional $45,662 |
Demographics Similar to Czechs by Per Capita Income
In terms of per capita income, the demographic groups most similar to Czechs are Immigrants from Armenia ($44,552, a difference of 0.10%), Korean ($44,522, a difference of 0.16%), Irish ($44,679, a difference of 0.19%), Immigrants from Eritrea ($44,509, a difference of 0.19%), and Norwegian ($44,480, a difference of 0.26%).
| Demographics | Rating | Rank | Per Capita Income |
| Immigrants | Jordan | 82.9 /100 | #140 | Excellent $45,066 |
| Slavs | 82.6 /100 | #141 | Excellent $45,049 |
| Ugandans | 82.6 /100 | #142 | Excellent $45,047 |
| Immigrants | Uganda | 82.5 /100 | #143 | Excellent $45,043 |
| Icelanders | 81.6 /100 | #144 | Excellent $44,987 |
| Immigrants | Afghanistan | 78.0 /100 | #145 | Good $44,790 |
| Irish | 75.8 /100 | #146 | Good $44,679 |
| Czechs | 74.1 /100 | #147 | Good $44,595 |
| Immigrants | Armenia | 73.1 /100 | #148 | Good $44,552 |
| Koreans | 72.5 /100 | #149 | Good $44,522 |
| Immigrants | Eritrea | 72.1 /100 | #150 | Good $44,509 |
| Norwegians | 71.5 /100 | #151 | Good $44,480 |
| Peruvians | 71.5 /100 | #152 | Good $44,479 |
| Scottish | 70.6 /100 | #153 | Good $44,440 |
| Portuguese | 68.7 /100 | #154 | Good $44,362 |