Basque vs Czech Per Capita Income
COMPARE
Basque
Czech
Per Capita Income
Per Capita Income Comparison
Basques
Czechs
$45,086
PER CAPITA INCOME
83.2/ 100
METRIC RATING
139th/ 347
METRIC RANK
$44,595
PER CAPITA INCOME
74.1/ 100
METRIC RATING
147th/ 347
METRIC RANK
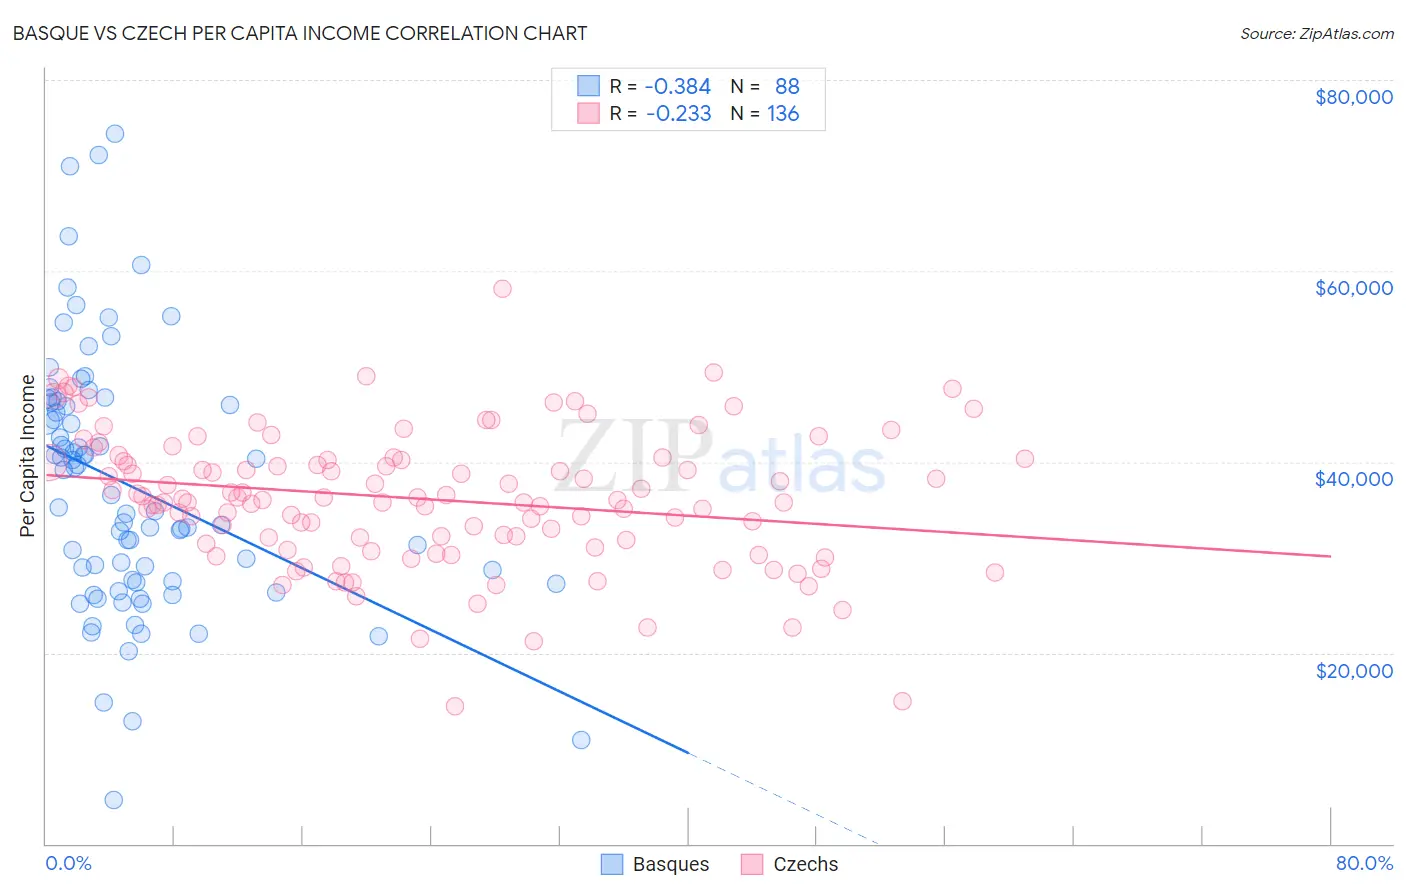
Basque vs Czech Per Capita Income Correlation Chart
The statistical analysis conducted on geographies consisting of 165,779,827 people shows a mild negative correlation between the proportion of Basques and per capita income in the United States with a correlation coefficient (R) of -0.384 and weighted average of $45,086. Similarly, the statistical analysis conducted on geographies consisting of 484,845,584 people shows a weak negative correlation between the proportion of Czechs and per capita income in the United States with a correlation coefficient (R) of -0.233 and weighted average of $44,595, a difference of 1.1%.
Per Capita Income Correlation Summary
| Measurement | Basque | Czech |
| Minimum | $4,617 | $14,339 |
| Maximum | $74,412 | $58,093 |
| Range | $69,795 | $43,754 |
| Mean | $37,448 | $36,126 |
| Median | $35,882 | $36,098 |
| Interquartile 25% (IQ1) | $27,463 | $31,633 |
| Interquartile 75% (IQ3) | $46,112 | $40,288 |
| Interquartile Range (IQR) | $18,649 | $8,655 |
| Standard Deviation (Sample) | $13,380 | $7,126 |
| Standard Deviation (Population) | $13,304 | $7,100 |
Demographics Similar to Basques and Czechs by Per Capita Income
In terms of per capita income, the demographic groups most similar to Basques are Immigrants from Jordan ($45,066, a difference of 0.050%), Slavic ($45,049, a difference of 0.080%), Ugandan ($45,047, a difference of 0.090%), Immigrants from Uganda ($45,043, a difference of 0.10%), and Icelander ($44,987, a difference of 0.22%). Similarly, the demographic groups most similar to Czechs are Immigrants from Armenia ($44,552, a difference of 0.10%), Korean ($44,522, a difference of 0.16%), Irish ($44,679, a difference of 0.19%), Immigrants from Eritrea ($44,509, a difference of 0.19%), and Norwegian ($44,480, a difference of 0.26%).
| Demographics | Rating | Rank | Per Capita Income |
| Pakistanis | 89.7 /100 | #133 | Excellent $45,587 |
| Slovenes | 89.6 /100 | #134 | Excellent $45,581 |
| Hungarians | 87.9 /100 | #135 | Excellent $45,426 |
| Immigrants | Oceania | 85.2 /100 | #136 | Excellent $45,220 |
| Immigrants | Syria | 85.2 /100 | #137 | Excellent $45,218 |
| Assyrians/Chaldeans/Syriacs | 84.8 /100 | #138 | Excellent $45,195 |
| Basques | 83.2 /100 | #139 | Excellent $45,086 |
| Immigrants | Jordan | 82.9 /100 | #140 | Excellent $45,066 |
| Slavs | 82.6 /100 | #141 | Excellent $45,049 |
| Ugandans | 82.6 /100 | #142 | Excellent $45,047 |
| Immigrants | Uganda | 82.5 /100 | #143 | Excellent $45,043 |
| Icelanders | 81.6 /100 | #144 | Excellent $44,987 |
| Immigrants | Afghanistan | 78.0 /100 | #145 | Good $44,790 |
| Irish | 75.8 /100 | #146 | Good $44,679 |
| Czechs | 74.1 /100 | #147 | Good $44,595 |
| Immigrants | Armenia | 73.1 /100 | #148 | Good $44,552 |
| Koreans | 72.5 /100 | #149 | Good $44,522 |
| Immigrants | Eritrea | 72.1 /100 | #150 | Good $44,509 |
| Norwegians | 71.5 /100 | #151 | Good $44,480 |
| Peruvians | 71.5 /100 | #152 | Good $44,479 |
| Scottish | 70.6 /100 | #153 | Good $44,440 |