Lebanese vs Immigrants from Jamaica Per Capita Income
COMPARE
Lebanese
Immigrants from Jamaica
Per Capita Income
Per Capita Income Comparison
Lebanese
Immigrants from Jamaica
$45,840
PER CAPITA INCOME
92.0/ 100
METRIC RATING
123rd/ 347
METRIC RANK
$38,766
PER CAPITA INCOME
0.4/ 100
METRIC RATING
269th/ 347
METRIC RANK
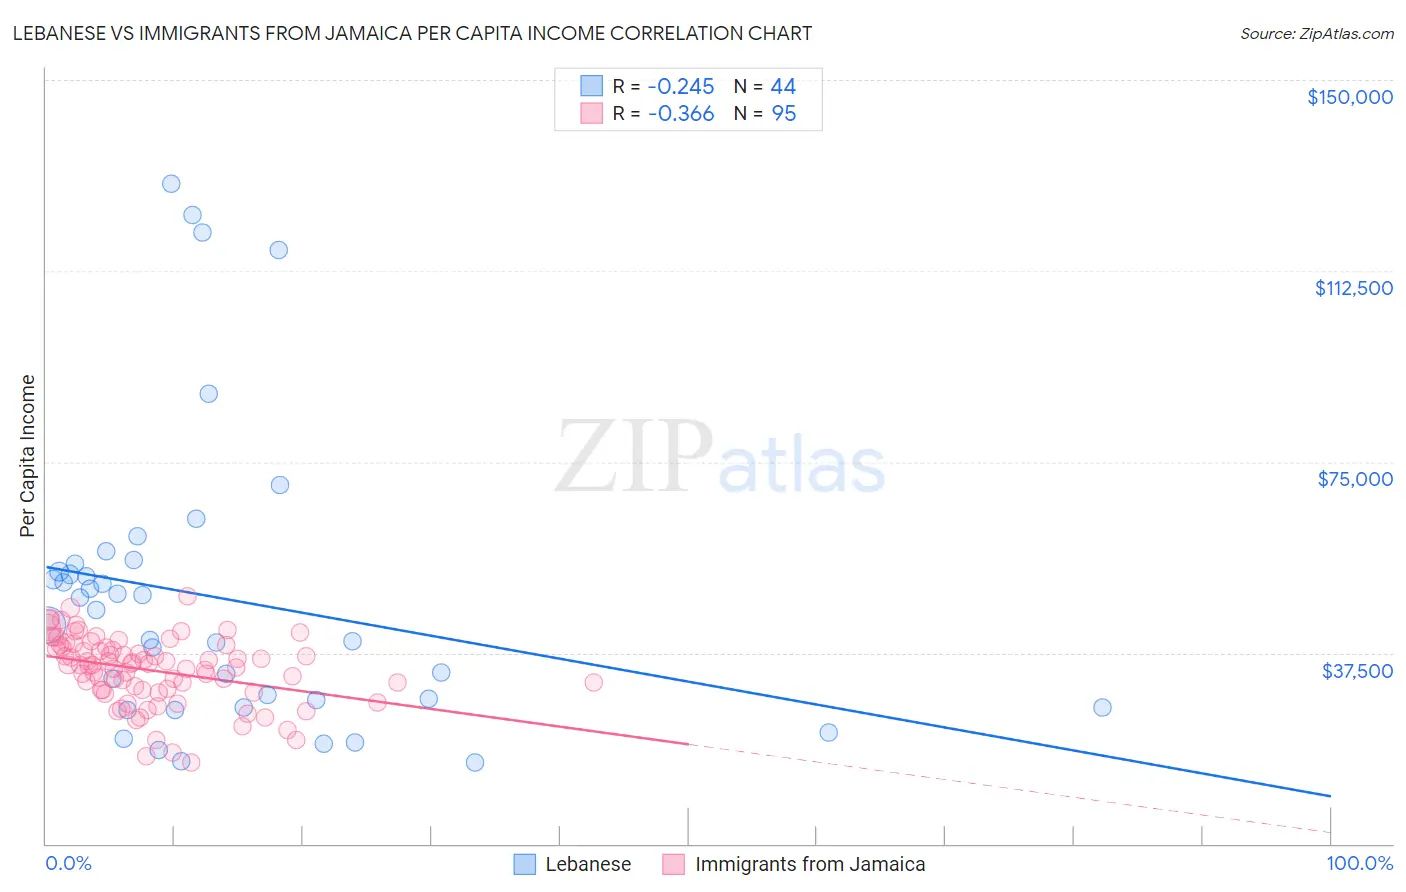
Lebanese vs Immigrants from Jamaica Per Capita Income Correlation Chart
The statistical analysis conducted on geographies consisting of 401,645,404 people shows a weak negative correlation between the proportion of Lebanese and per capita income in the United States with a correlation coefficient (R) of -0.245 and weighted average of $45,840. Similarly, the statistical analysis conducted on geographies consisting of 301,814,943 people shows a mild negative correlation between the proportion of Immigrants from Jamaica and per capita income in the United States with a correlation coefficient (R) of -0.366 and weighted average of $38,766, a difference of 18.2%.
Per Capita Income Correlation Summary
| Measurement | Lebanese | Immigrants from Jamaica |
| Minimum | $15,839 | $16,033 |
| Maximum | $129,581 | $48,680 |
| Range | $113,742 | $32,647 |
| Mean | $48,201 | $34,027 |
| Median | $44,395 | $35,066 |
| Interquartile 25% (IQ1) | $27,415 | $30,104 |
| Interquartile 75% (IQ3) | $54,286 | $38,633 |
| Interquartile Range (IQR) | $26,871 | $8,529 |
| Standard Deviation (Sample) | $28,531 | $6,626 |
| Standard Deviation (Population) | $28,205 | $6,591 |
Similar Demographics by Per Capita Income
Demographics Similar to Lebanese by Per Capita Income
In terms of per capita income, the demographic groups most similar to Lebanese are European ($45,836, a difference of 0.010%), Moroccan ($45,854, a difference of 0.030%), Canadian ($45,858, a difference of 0.040%), Zimbabwean ($45,804, a difference of 0.080%), and Palestinian ($45,790, a difference of 0.11%).
| Demographics | Rating | Rank | Per Capita Income |
| Poles | 94.1 /100 | #116 | Exceptional $46,123 |
| Chinese | 93.9 /100 | #117 | Exceptional $46,098 |
| Immigrants | Saudi Arabia | 93.3 /100 | #118 | Exceptional $46,008 |
| Immigrants | Poland | 93.1 /100 | #119 | Exceptional $45,979 |
| Immigrants | Ethiopia | 92.7 /100 | #120 | Exceptional $45,923 |
| Canadians | 92.2 /100 | #121 | Exceptional $45,858 |
| Moroccans | 92.1 /100 | #122 | Exceptional $45,854 |
| Lebanese | 92.0 /100 | #123 | Exceptional $45,840 |
| Europeans | 92.0 /100 | #124 | Exceptional $45,836 |
| Zimbabweans | 91.7 /100 | #125 | Exceptional $45,804 |
| Palestinians | 91.6 /100 | #126 | Exceptional $45,790 |
| Immigrants | Germany | 91.3 /100 | #127 | Exceptional $45,751 |
| Swedes | 91.3 /100 | #128 | Exceptional $45,750 |
| Luxembourgers | 90.4 /100 | #129 | Exceptional $45,663 |
| Arabs | 90.4 /100 | #130 | Exceptional $45,662 |
Demographics Similar to Immigrants from Jamaica by Per Capita Income
In terms of per capita income, the demographic groups most similar to Immigrants from Jamaica are Liberian ($38,780, a difference of 0.040%), Immigrants from Zaire ($38,848, a difference of 0.21%), Salvadoran ($38,858, a difference of 0.24%), Immigrants from Belize ($38,614, a difference of 0.39%), and Central American ($38,560, a difference of 0.53%).
| Demographics | Rating | Rank | Per Capita Income |
| Iroquois | 0.6 /100 | #262 | Tragic $39,104 |
| Belizeans | 0.6 /100 | #263 | Tragic $39,097 |
| Americans | 0.6 /100 | #264 | Tragic $39,039 |
| Spanish Americans | 0.5 /100 | #265 | Tragic $39,012 |
| Salvadorans | 0.5 /100 | #266 | Tragic $38,858 |
| Immigrants | Zaire | 0.4 /100 | #267 | Tragic $38,848 |
| Liberians | 0.4 /100 | #268 | Tragic $38,780 |
| Immigrants | Jamaica | 0.4 /100 | #269 | Tragic $38,766 |
| Immigrants | Belize | 0.3 /100 | #270 | Tragic $38,614 |
| Central Americans | 0.3 /100 | #271 | Tragic $38,560 |
| Immigrants | Cabo Verde | 0.3 /100 | #272 | Tragic $38,540 |
| Nepalese | 0.3 /100 | #273 | Tragic $38,442 |
| Immigrants | El Salvador | 0.3 /100 | #274 | Tragic $38,394 |
| Immigrants | Liberia | 0.2 /100 | #275 | Tragic $38,165 |
| Hmong | 0.2 /100 | #276 | Tragic $38,120 |