Immigrants from Romania vs Czech Per Capita Income
COMPARE
Immigrants from Romania
Czech
Per Capita Income
Per Capita Income Comparison
Immigrants from Romania
Czechs
$49,463
PER CAPITA INCOME
99.9/ 100
METRIC RATING
67th/ 347
METRIC RANK
$44,595
PER CAPITA INCOME
74.1/ 100
METRIC RATING
147th/ 347
METRIC RANK
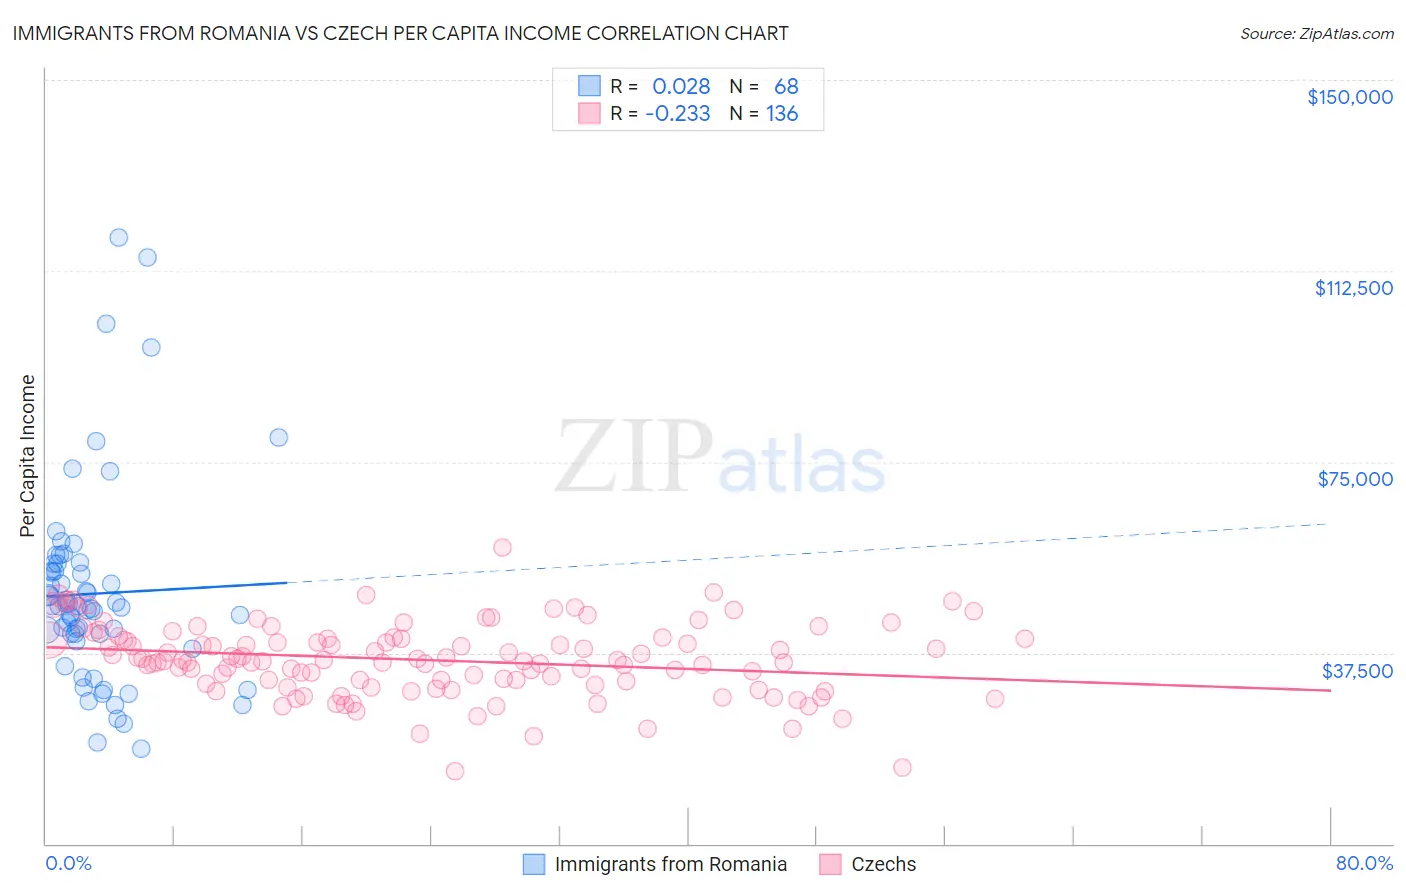
Immigrants from Romania vs Czech Per Capita Income Correlation Chart
The statistical analysis conducted on geographies consisting of 256,972,544 people shows no correlation between the proportion of Immigrants from Romania and per capita income in the United States with a correlation coefficient (R) of 0.028 and weighted average of $49,463. Similarly, the statistical analysis conducted on geographies consisting of 484,845,584 people shows a weak negative correlation between the proportion of Czechs and per capita income in the United States with a correlation coefficient (R) of -0.233 and weighted average of $44,595, a difference of 10.9%.
Per Capita Income Correlation Summary
| Measurement | Immigrants from Romania | Czech |
| Minimum | $18,731 | $14,339 |
| Maximum | $119,092 | $58,093 |
| Range | $100,361 | $43,754 |
| Mean | $49,122 | $36,126 |
| Median | $46,712 | $36,098 |
| Interquartile 25% (IQ1) | $40,435 | $31,633 |
| Interquartile 75% (IQ3) | $54,228 | $40,288 |
| Interquartile Range (IQR) | $13,794 | $8,655 |
| Standard Deviation (Sample) | $19,681 | $7,126 |
| Standard Deviation (Population) | $19,535 | $7,100 |
Similar Demographics by Per Capita Income
Demographics Similar to Immigrants from Romania by Per Capita Income
In terms of per capita income, the demographic groups most similar to Immigrants from Romania are Lithuanian ($49,448, a difference of 0.030%), Immigrants from Bulgaria ($49,482, a difference of 0.040%), Immigrants from Canada ($49,412, a difference of 0.10%), Bolivian ($49,526, a difference of 0.13%), and Immigrants from Eastern Europe ($49,316, a difference of 0.30%).
| Demographics | Rating | Rank | Per Capita Income |
| Immigrants | Scotland | 99.9 /100 | #60 | Exceptional $49,893 |
| Argentineans | 99.9 /100 | #61 | Exceptional $49,862 |
| Immigrants | Asia | 99.9 /100 | #62 | Exceptional $49,741 |
| Maltese | 99.9 /100 | #63 | Exceptional $49,640 |
| Immigrants | Argentina | 99.9 /100 | #64 | Exceptional $49,627 |
| Bolivians | 99.9 /100 | #65 | Exceptional $49,526 |
| Immigrants | Bulgaria | 99.9 /100 | #66 | Exceptional $49,482 |
| Immigrants | Romania | 99.9 /100 | #67 | Exceptional $49,463 |
| Lithuanians | 99.8 /100 | #68 | Exceptional $49,448 |
| Immigrants | Canada | 99.8 /100 | #69 | Exceptional $49,412 |
| Immigrants | Eastern Europe | 99.8 /100 | #70 | Exceptional $49,316 |
| Greeks | 99.8 /100 | #71 | Exceptional $49,309 |
| Immigrants | Hungary | 99.8 /100 | #72 | Exceptional $49,303 |
| Immigrants | North America | 99.8 /100 | #73 | Exceptional $49,302 |
| Mongolians | 99.8 /100 | #74 | Exceptional $49,173 |
Demographics Similar to Czechs by Per Capita Income
In terms of per capita income, the demographic groups most similar to Czechs are Immigrants from Armenia ($44,552, a difference of 0.10%), Korean ($44,522, a difference of 0.16%), Irish ($44,679, a difference of 0.19%), Immigrants from Eritrea ($44,509, a difference of 0.19%), and Norwegian ($44,480, a difference of 0.26%).
| Demographics | Rating | Rank | Per Capita Income |
| Immigrants | Jordan | 82.9 /100 | #140 | Excellent $45,066 |
| Slavs | 82.6 /100 | #141 | Excellent $45,049 |
| Ugandans | 82.6 /100 | #142 | Excellent $45,047 |
| Immigrants | Uganda | 82.5 /100 | #143 | Excellent $45,043 |
| Icelanders | 81.6 /100 | #144 | Excellent $44,987 |
| Immigrants | Afghanistan | 78.0 /100 | #145 | Good $44,790 |
| Irish | 75.8 /100 | #146 | Good $44,679 |
| Czechs | 74.1 /100 | #147 | Good $44,595 |
| Immigrants | Armenia | 73.1 /100 | #148 | Good $44,552 |
| Koreans | 72.5 /100 | #149 | Good $44,522 |
| Immigrants | Eritrea | 72.1 /100 | #150 | Good $44,509 |
| Norwegians | 71.5 /100 | #151 | Good $44,480 |
| Peruvians | 71.5 /100 | #152 | Good $44,479 |
| Scottish | 70.6 /100 | #153 | Good $44,440 |
| Portuguese | 68.7 /100 | #154 | Good $44,362 |