Lebanese vs Czech Unemployment Among Women with Children Under 6 years

COMPARE

Lebanese
Race
Ancestry
AfghanAfricanAlaska NativeAlaskan AthabascanAlbanianAleutAlsatianAmericanApacheArabArapahoArgentineanArmenianAssyrian/Chaldean/SyriacAustralianAustrianBahamianBangladeshiBarbadianBasqueBelgianBelizeanBermudanBhutaneseBlackfeetBolivianBrazilianBritishBritish West IndianBulgarianBurmeseCajunCambodianCanadianCape VerdeanCarpatho RusynCelticCentral AmericanCentral American IndianCherokeeCheyenneChickasawChileanChineseChippewaChoctawColombianColvilleComancheCosta RicanCreeCreekCroatianCrowCubanCypriotCzechoslovakianDanishDelawareDominicanDutchDutch West IndianEastern EuropeanEcuadorianEgyptianEnglishEstonianEthiopianEuropeanFijianFilipinoFinnishFrenchFrench American IndianFrench CanadianGermanGerman RussianGhanaianGreekGuamanian/ChamorroGuatemalanGuyaneseHaitianHmongHonduranHopiHoumaHungarianIcelanderIndian (Asian)IndonesianInupiatIranianIraqiIrishIroquoisIsraeliItalianJamaicanJapaneseJordanianKenyanKiowaKoreanLaotianLatvianLebaneseLiberianLithuanianLumbeeLuxembourgerMacedonianMalaysianMalteseMarshalleseMenomineeMexicanMexican American IndianMongolianMoroccanNative HawaiianNavajoNepaleseNew ZealanderNicaraguanNigerianNorthern EuropeanNorwegianOkinawanOsageOttawaPaiutePakistaniPalestinianPanamanianParaguayanPennsylvania GermanPeruvianPimaPolishPortuguesePotawatomiPuebloPuerto RicanPuget Sound SalishRomanianRussianSalvadoranSamoanScandinavianScotch-IrishScottishSeminoleSenegaleseSerbianShoshoneSierra LeoneanSiouxSlavicSlovakSloveneSomaliSouth AfricanSouth AmericanSouth American IndianSoviet UnionSpaniardSpanishSpanish AmericanSpanish American IndianSri LankanSubsaharan AfricanSudaneseSwedishSwissSyrianTaiwaneseThaiTlingit-HaidaTohono O'OdhamTonganTrinidadian and TobagonianTsimshianTurkishU.S. Virgin IslanderUgandanUkrainianUruguayanUteVenezuelanVietnameseWelshWest IndianYakamaYaquiYugoslavianYumanYup'ikZimbabwean
Immigration
NonimmigrantsImmigrantsAfghanistanAfricaAlbaniaArgentinaArmeniaAsiaAustraliaAustriaBahamasBangladeshBarbadosBelarusBelgiumBelizeBoliviaBosnia and HerzegovinaBrazilBulgariaBurma/MyanmarCabo VerdeCambodiaCameroonCanadaCaribbeanCentral AmericaChileChinaColombiaCongoCosta RicaCroatiaCubaCzechoslovakiaDenmarkDominicaDominican RepublicEastern AfricaEastern AsiaEastern EuropeEcuadorEgyptEl SalvadorEnglandEritreaEthiopiaEuropeFijiFranceGermanyGhanaGreeceGrenadaGuatemalaGuyanaHaitiHondurasHong KongHungaryIndiaIndonesiaIranIraqIrelandIsraelItalyJamaicaJapanJordanKazakhstanKenyaKoreaKuwaitLaosLatin AmericaLatviaLebanonLiberiaLithuaniaMalaysiaMexicoMicronesiaMiddle AfricaMoldovaMoroccoNepalNetherlandsNicaraguaNigeriaNorth AmericaNorth MacedoniaNorthern AfricaNorthern EuropeNorwayOceaniaPakistanPanamaPeruPhilippinesPolandPortugalRomaniaRussiaSaudi ArabiaScotlandSenegalSerbiaSierra LeoneSingaporeSomaliaSouth AfricaSouth AmericaSouth Central AsiaSouth Eastern AsiaSouthern EuropeSpainSri LankaSt. Vincent and the GrenadinesSudanSwedenSwitzerlandSyriaTaiwanThailandTrinidad and TobagoTurkeyUgandaUkraineUruguayUzbekistanVenezuelaVietnamWest IndiesWestern AfricaWestern AsiaWestern EuropeYemenZaireZimbabweAzores
Czech
Race
Ancestry
AfghanAfricanAlaska NativeAlaskan AthabascanAlbanianAleutAlsatianAmericanApacheArabArapahoArgentineanArmenianAssyrian/Chaldean/SyriacAustralianAustrianBahamianBangladeshiBarbadianBasqueBelgianBelizeanBermudanBhutaneseBlackfeetBolivianBrazilianBritishBritish West IndianBulgarianBurmeseCajunCambodianCanadianCape VerdeanCarpatho RusynCelticCentral AmericanCentral American IndianCherokeeCheyenneChickasawChileanChineseChippewaChoctawColombianColvilleComancheCosta RicanCreeCreekCroatianCrowCubanCypriotCzechCzechoslovakianDanishDelawareDominicanDutchDutch West IndianEastern EuropeanEcuadorianEgyptianEnglishEstonianEthiopianEuropeanFijianFilipinoFinnishFrenchFrench American IndianFrench CanadianGermanGerman RussianGhanaianGreekGuamanian/ChamorroGuatemalanGuyaneseHaitianHmongHonduranHopiHoumaHungarianIcelanderIndian (Asian)IndonesianInupiatIranianIraqiIrishIroquoisIsraeliItalianJamaicanJapaneseJordanianKenyanKiowaKoreanLaotianLatvianLiberianLithuanianLumbeeLuxembourgerMacedonianMalaysianMalteseMarshalleseMenomineeMexicanMexican American IndianMongolianMoroccanNative HawaiianNavajoNepaleseNew ZealanderNicaraguanNigerianNorthern EuropeanNorwegianOkinawanOsageOttawaPaiutePakistaniPalestinianPanamanianParaguayanPennsylvania GermanPeruvianPimaPolishPortuguesePotawatomiPuebloPuerto RicanPuget Sound SalishRomanianRussianSalvadoranSamoanScandinavianScotch-IrishScottishSeminoleSenegaleseSerbianShoshoneSierra LeoneanSiouxSlavicSlovakSloveneSomaliSouth AfricanSouth AmericanSouth American IndianSoviet UnionSpaniardSpanishSpanish AmericanSpanish American IndianSri LankanSubsaharan AfricanSudaneseSwedishSwissSyrianTaiwaneseThaiTlingit-HaidaTohono O'OdhamTonganTrinidadian and TobagonianTsimshianTurkishU.S. Virgin IslanderUgandanUkrainianUruguayanUteVenezuelanVietnameseWelshWest IndianYakamaYaquiYugoslavianYumanYup'ikZimbabwean
Immigration
NonimmigrantsImmigrantsAfghanistanAfricaAlbaniaArgentinaArmeniaAsiaAustraliaAustriaBahamasBangladeshBarbadosBelarusBelgiumBelizeBoliviaBosnia and HerzegovinaBrazilBulgariaBurma/MyanmarCabo VerdeCambodiaCameroonCanadaCaribbeanCentral AmericaChileChinaColombiaCongoCosta RicaCroatiaCubaCzechoslovakiaDenmarkDominicaDominican RepublicEastern AfricaEastern AsiaEastern EuropeEcuadorEgyptEl SalvadorEnglandEritreaEthiopiaEuropeFijiFranceGermanyGhanaGreeceGrenadaGuatemalaGuyanaHaitiHondurasHong KongHungaryIndiaIndonesiaIranIraqIrelandIsraelItalyJamaicaJapanJordanKazakhstanKenyaKoreaKuwaitLaosLatin AmericaLatviaLebanonLiberiaLithuaniaMalaysiaMexicoMicronesiaMiddle AfricaMoldovaMoroccoNepalNetherlandsNicaraguaNigeriaNorth AmericaNorth MacedoniaNorthern AfricaNorthern EuropeNorwayOceaniaPakistanPanamaPeruPhilippinesPolandPortugalRomaniaRussiaSaudi ArabiaScotlandSenegalSerbiaSierra LeoneSingaporeSomaliaSouth AfricaSouth AmericaSouth Central AsiaSouth Eastern AsiaSouthern EuropeSpainSri LankaSt. Vincent and the GrenadinesSudanSwedenSwitzerlandSyriaTaiwanThailandTrinidad and TobagoTurkeyUgandaUkraineUruguayUzbekistanVenezuelaVietnamWest IndiesWestern AfricaWestern AsiaWestern EuropeYemenZaireZimbabweAzores
Unemployment Among Women with Children Under 6 years
Income
Poverty
Unemployment
Labor Participation
Family Structure
Vehicle Availability
Education Level
Disability

Unemployment Among Women with Children Under 6 years Comparison

Lebanese

Czechs

Fair
Average
7.8%
UNEMPLOYMENT AMONG WOMEN WITH CHILDREN UNDER 6 YEARS
22.2/ 100
METRIC RATING
204th/ 347
METRIC RANK
7.6%
UNEMPLOYMENT AMONG WOMEN WITH CHILDREN UNDER 6 YEARS
59.8/ 100
METRIC RATING
170th/ 347
METRIC RANK

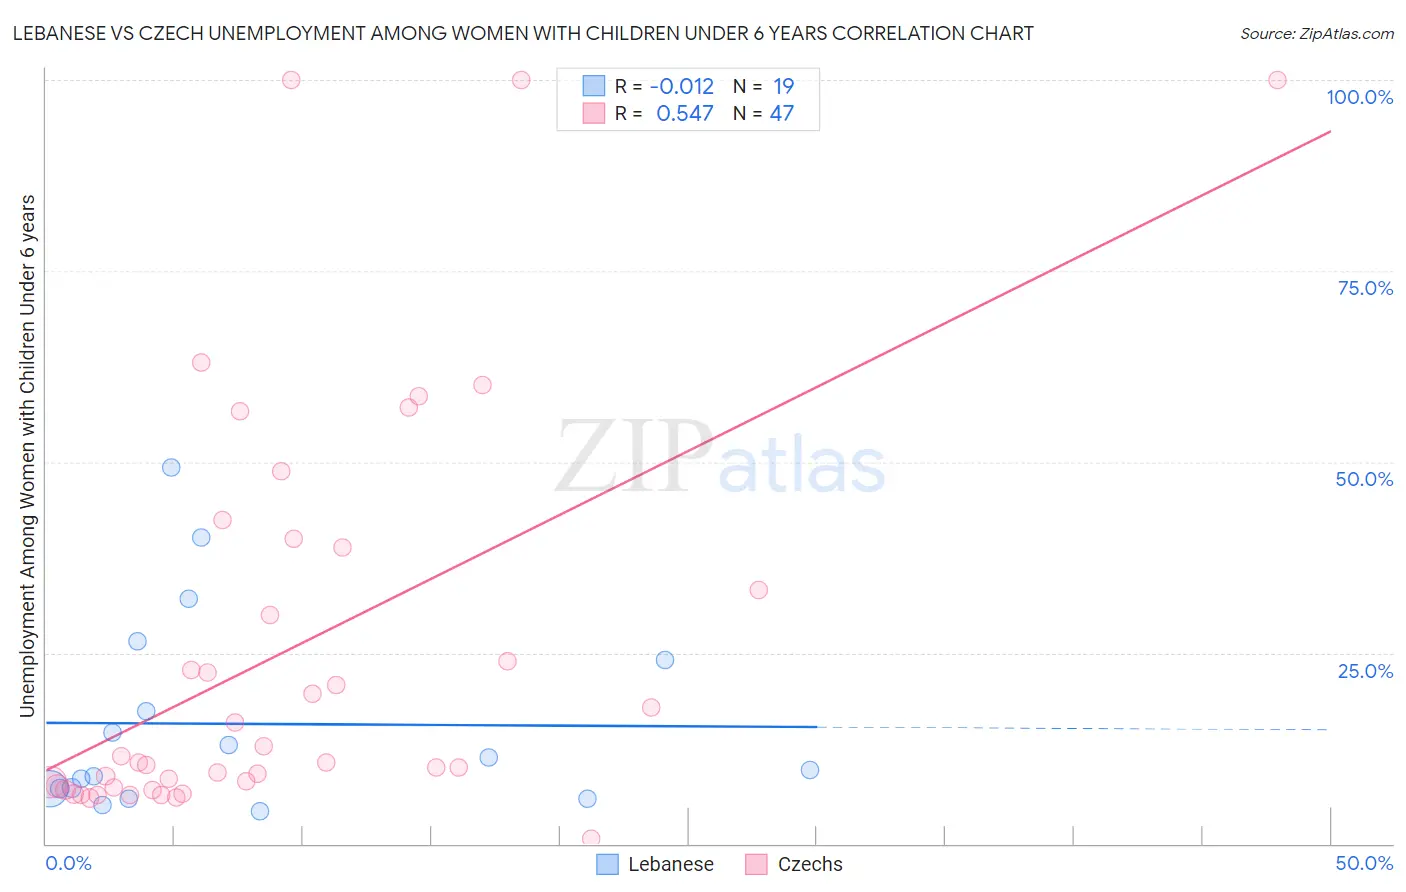
Lebanese vs Czech Unemployment Among Women with Children Under 6 years Correlation Chart

The statistical analysis conducted on geographies consisting of 301,337,117 people shows no correlation between the proportion of Lebanese and unemployment rate among women with children under the age of 6 in the United States with a correlation coefficient (R) of -0.012 and weighted average of 7.8%. Similarly, the statistical analysis conducted on geographies consisting of 337,488,304 people shows a substantial positive correlation between the proportion of Czechs and unemployment rate among women with children under the age of 6 in the United States with a correlation coefficient (R) of 0.547 and weighted average of 7.6%, a difference of 2.8%.
Lebanese vs Czech Unemployment Among Women with Children Under 6 years

Unemployment Among Women with Children Under 6 years Correlation Summary

MeasurementLebaneseCzech
Minimum4.3%0.70%
Maximum49.3%100.0%
Range45.0%99.3%
Mean15.7%25.1%
Median9.6%10.7%
Interquartile 25% (IQ1)7.2%7.4%
Interquartile 75% (IQ3)24.0%38.8%
Interquartile Range (IQR)16.8%31.4%
Standard Deviation (Sample)12.9%26.3%
Standard Deviation (Population)12.5%26.1%

Similar Demographics by Unemployment Among Women with Children Under 6 years

Demographics Similar to Lebanese by Unemployment Among Women with Children Under 6 years

In terms of unemployment among women with children under 6 years, the demographic groups most similar to Lebanese are Immigrants (7.8%, a difference of 0.080%), Hungarian (7.8%, a difference of 0.10%), Spaniard (7.8%, a difference of 0.11%), Sudanese (7.8%, a difference of 0.12%), and Canadian (7.8%, a difference of 0.15%).
DemographicsRating | RankUnemployment Among Women with Children Under 6 years
Italians
30.4
/100
|
#197
Fair
7.7%
Lithuanians
30.0
/100
|
#198
Fair
7.8%
Immigrants | Poland
27.3
/100
|
#199
Fair
7.8%
Guamanians/Chamorros
25.5
/100
|
#200
Fair
7.8%
Basques
24.7
/100
|
#201
Fair
7.8%
Sudanese
23.5
/100
|
#202
Fair
7.8%
Spaniards
23.3
/100
|
#203
Fair
7.8%
Lebanese
22.2
/100
|
#204
Fair
7.8%
Immigrants | Immigrants
21.4
/100
|
#205
Fair
7.8%
Hungarians
21.2
/100
|
#206
Fair
7.8%
Canadians
20.6
/100
|
#207
Fair
7.8%
Immigrants | Syria
18.9
/100
|
#208
Poor
7.8%
Costa Ricans
17.6
/100
|
#209
Poor
7.8%
Poles
16.0
/100
|
#210
Poor
7.9%
Immigrants | Ecuador
14.9
/100
|
#211
Poor
7.9%

Demographics Similar to Czechs by Unemployment Among Women with Children Under 6 years

In terms of unemployment among women with children under 6 years, the demographic groups most similar to Czechs are Immigrants from Grenada (7.6%, a difference of 0.060%), Immigrants from Scotland (7.6%, a difference of 0.11%), Immigrants from Canada (7.6%, a difference of 0.12%), Immigrants from North America (7.6%, a difference of 0.14%), and Kenyan (7.6%, a difference of 0.19%).
DemographicsRating | RankUnemployment Among Women with Children Under 6 years
British
66.3
/100
|
#163
Good
7.6%
Ugandans
65.8
/100
|
#164
Good
7.6%
Immigrants | South America
65.6
/100
|
#165
Good
7.6%
Belgians
63.5
/100
|
#166
Good
7.6%
Kenyans
62.5
/100
|
#167
Good
7.6%
Immigrants | Canada
61.6
/100
|
#168
Good
7.6%
Immigrants | Scotland
61.3
/100
|
#169
Good
7.6%
Czechs
59.8
/100
|
#170
Average
7.6%
Immigrants | Grenada
59.0
/100
|
#171
Average
7.6%
Immigrants | North America
57.7
/100
|
#172
Average
7.6%
Cree
51.6
/100
|
#173
Average
7.6%
Immigrants | Laos
50.0
/100
|
#174
Average
7.6%
Panamanians
49.6
/100
|
#175
Average
7.6%
Puget Sound Salish
47.7
/100
|
#176
Average
7.7%
Austrians
46.0
/100
|
#177
Average
7.7%