Lebanese vs Mexican American Indian Per Capita Income
COMPARE
Lebanese
Mexican American Indian
Per Capita Income
Per Capita Income Comparison
Lebanese
Mexican American Indians
$45,840
PER CAPITA INCOME
92.0/ 100
METRIC RATING
123rd/ 347
METRIC RANK
$37,407
PER CAPITA INCOME
0.1/ 100
METRIC RATING
293rd/ 347
METRIC RANK
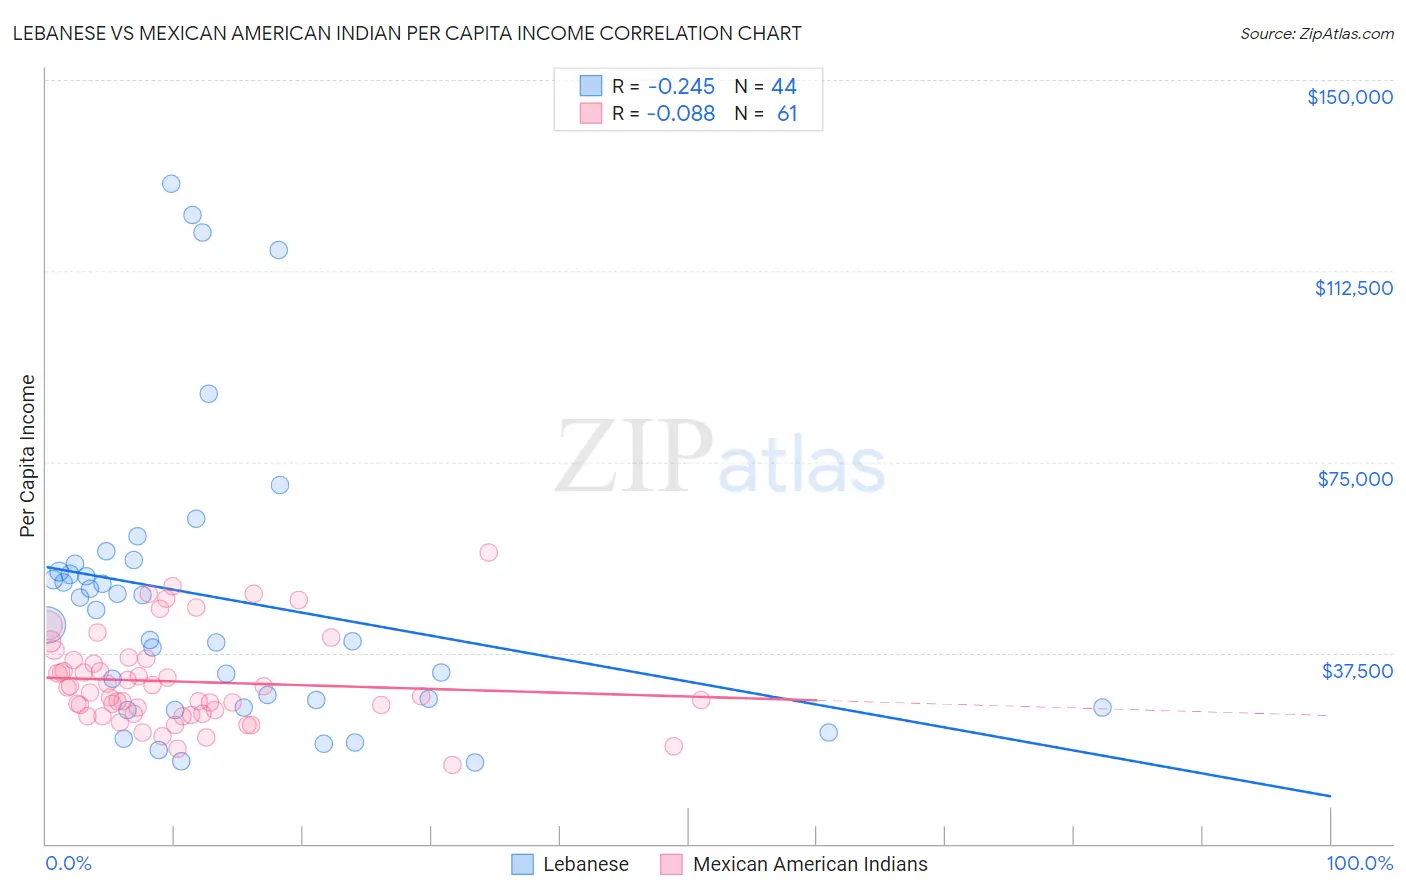
Lebanese vs Mexican American Indian Per Capita Income Correlation Chart
The statistical analysis conducted on geographies consisting of 401,645,404 people shows a weak negative correlation between the proportion of Lebanese and per capita income in the United States with a correlation coefficient (R) of -0.245 and weighted average of $45,840. Similarly, the statistical analysis conducted on geographies consisting of 317,620,021 people shows a slight negative correlation between the proportion of Mexican American Indians and per capita income in the United States with a correlation coefficient (R) of -0.088 and weighted average of $37,407, a difference of 22.5%.
Per Capita Income Correlation Summary
| Measurement | Lebanese | Mexican American Indian |
| Minimum | $15,839 | $15,543 |
| Maximum | $129,581 | $57,099 |
| Range | $113,742 | $41,556 |
| Mean | $48,201 | $31,846 |
| Median | $44,395 | $29,756 |
| Interquartile 25% (IQ1) | $27,415 | $25,545 |
| Interquartile 75% (IQ3) | $54,286 | $36,256 |
| Interquartile Range (IQR) | $26,871 | $10,711 |
| Standard Deviation (Sample) | $28,531 | $8,902 |
| Standard Deviation (Population) | $28,205 | $8,828 |
Similar Demographics by Per Capita Income
Demographics Similar to Lebanese by Per Capita Income
In terms of per capita income, the demographic groups most similar to Lebanese are European ($45,836, a difference of 0.010%), Moroccan ($45,854, a difference of 0.030%), Canadian ($45,858, a difference of 0.040%), Zimbabwean ($45,804, a difference of 0.080%), and Palestinian ($45,790, a difference of 0.11%).
| Demographics | Rating | Rank | Per Capita Income |
| Poles | 94.1 /100 | #116 | Exceptional $46,123 |
| Chinese | 93.9 /100 | #117 | Exceptional $46,098 |
| Immigrants | Saudi Arabia | 93.3 /100 | #118 | Exceptional $46,008 |
| Immigrants | Poland | 93.1 /100 | #119 | Exceptional $45,979 |
| Immigrants | Ethiopia | 92.7 /100 | #120 | Exceptional $45,923 |
| Canadians | 92.2 /100 | #121 | Exceptional $45,858 |
| Moroccans | 92.1 /100 | #122 | Exceptional $45,854 |
| Lebanese | 92.0 /100 | #123 | Exceptional $45,840 |
| Europeans | 92.0 /100 | #124 | Exceptional $45,836 |
| Zimbabweans | 91.7 /100 | #125 | Exceptional $45,804 |
| Palestinians | 91.6 /100 | #126 | Exceptional $45,790 |
| Immigrants | Germany | 91.3 /100 | #127 | Exceptional $45,751 |
| Swedes | 91.3 /100 | #128 | Exceptional $45,750 |
| Luxembourgers | 90.4 /100 | #129 | Exceptional $45,663 |
| Arabs | 90.4 /100 | #130 | Exceptional $45,662 |
Demographics Similar to Mexican American Indians by Per Capita Income
In terms of per capita income, the demographic groups most similar to Mexican American Indians are Cuban ($37,383, a difference of 0.070%), Immigrants from Micronesia ($37,464, a difference of 0.15%), Immigrants from Dominican Republic ($37,306, a difference of 0.27%), Indonesian ($37,300, a difference of 0.29%), and Cajun ($37,527, a difference of 0.32%).
| Demographics | Rating | Rank | Per Capita Income |
| Central American Indians | 0.1 /100 | #286 | Tragic $37,699 |
| Dominicans | 0.1 /100 | #287 | Tragic $37,697 |
| Blackfeet | 0.1 /100 | #288 | Tragic $37,695 |
| U.S. Virgin Islanders | 0.1 /100 | #289 | Tragic $37,589 |
| Immigrants | Guatemala | 0.1 /100 | #290 | Tragic $37,550 |
| Cajuns | 0.1 /100 | #291 | Tragic $37,527 |
| Immigrants | Micronesia | 0.1 /100 | #292 | Tragic $37,464 |
| Mexican American Indians | 0.1 /100 | #293 | Tragic $37,407 |
| Cubans | 0.1 /100 | #294 | Tragic $37,383 |
| Immigrants | Dominican Republic | 0.1 /100 | #295 | Tragic $37,306 |
| Indonesians | 0.1 /100 | #296 | Tragic $37,300 |
| Haitians | 0.1 /100 | #297 | Tragic $37,289 |
| Immigrants | Caribbean | 0.1 /100 | #298 | Tragic $37,254 |
| Cherokee | 0.1 /100 | #299 | Tragic $37,203 |
| Immigrants | Bahamas | 0.1 /100 | #300 | Tragic $37,193 |