Spanish American vs Czech Per Capita Income
COMPARE
Spanish American
Czech
Per Capita Income
Per Capita Income Comparison
Spanish Americans
Czechs
$39,012
PER CAPITA INCOME
0.5/ 100
METRIC RATING
265th/ 347
METRIC RANK
$44,595
PER CAPITA INCOME
74.1/ 100
METRIC RATING
147th/ 347
METRIC RANK
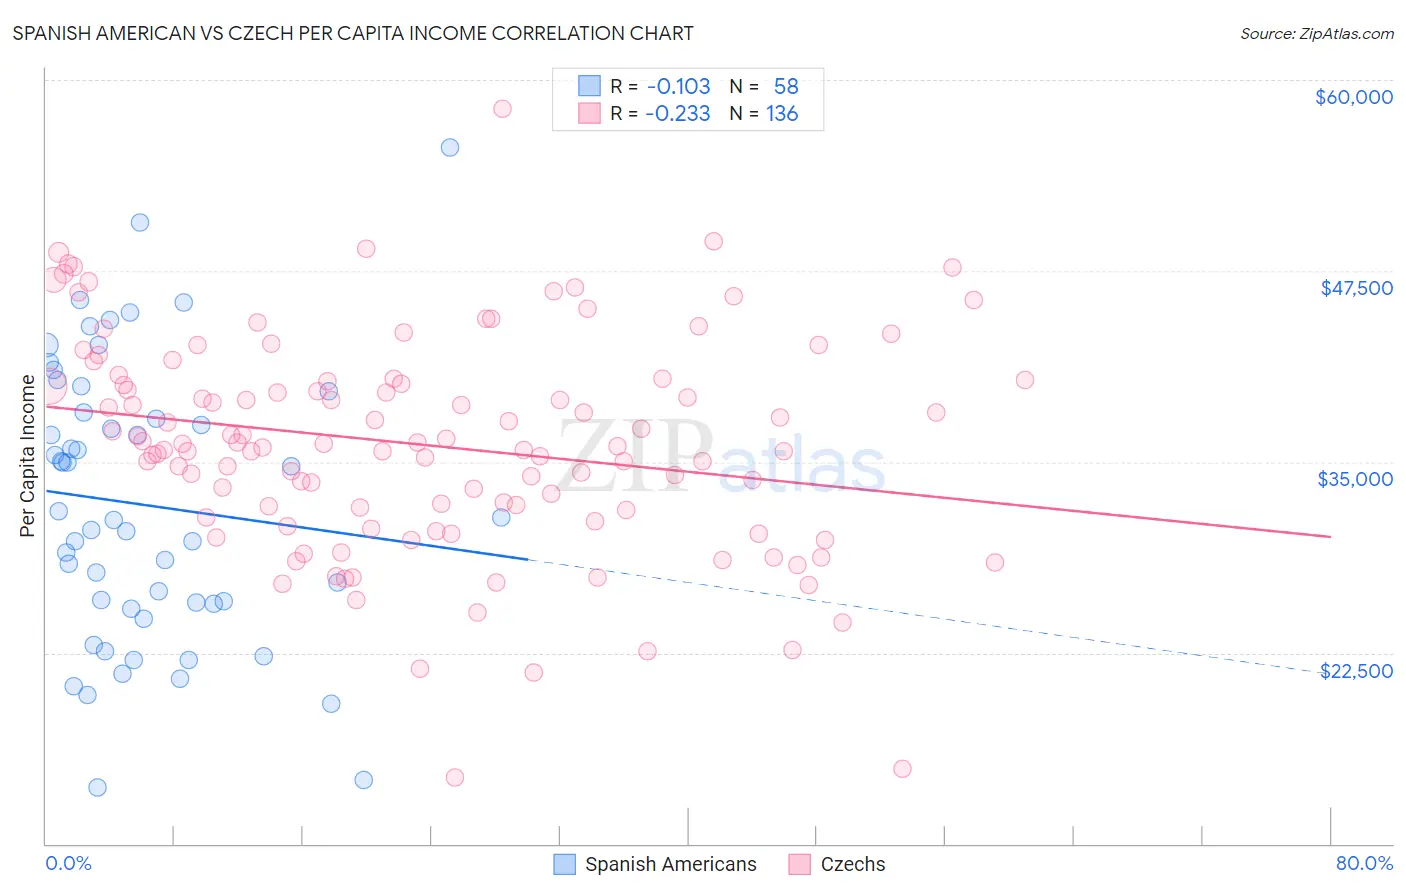
Spanish American vs Czech Per Capita Income Correlation Chart
The statistical analysis conducted on geographies consisting of 103,168,021 people shows a poor negative correlation between the proportion of Spanish Americans and per capita income in the United States with a correlation coefficient (R) of -0.103 and weighted average of $39,012. Similarly, the statistical analysis conducted on geographies consisting of 484,845,584 people shows a weak negative correlation between the proportion of Czechs and per capita income in the United States with a correlation coefficient (R) of -0.233 and weighted average of $44,595, a difference of 14.3%.
Per Capita Income Correlation Summary
| Measurement | Spanish American | Czech |
| Minimum | $13,649 | $14,339 |
| Maximum | $55,562 | $58,093 |
| Range | $41,913 | $43,754 |
| Mean | $32,169 | $36,126 |
| Median | $31,264 | $36,098 |
| Interquartile 25% (IQ1) | $25,700 | $31,633 |
| Interquartile 75% (IQ3) | $38,250 | $40,288 |
| Interquartile Range (IQR) | $12,550 | $8,655 |
| Standard Deviation (Sample) | $9,124 | $7,126 |
| Standard Deviation (Population) | $9,045 | $7,100 |
Similar Demographics by Per Capita Income
Demographics Similar to Spanish Americans by Per Capita Income
In terms of per capita income, the demographic groups most similar to Spanish Americans are American ($39,039, a difference of 0.070%), Belizean ($39,097, a difference of 0.22%), Iroquois ($39,104, a difference of 0.23%), Marshallese ($39,108, a difference of 0.25%), and Alaskan Athabascan ($39,163, a difference of 0.39%).
| Demographics | Rating | Rank | Per Capita Income |
| Jamaicans | 0.7 /100 | #258 | Tragic $39,231 |
| Malaysians | 0.7 /100 | #259 | Tragic $39,194 |
| Alaskan Athabascans | 0.6 /100 | #260 | Tragic $39,163 |
| Marshallese | 0.6 /100 | #261 | Tragic $39,108 |
| Iroquois | 0.6 /100 | #262 | Tragic $39,104 |
| Belizeans | 0.6 /100 | #263 | Tragic $39,097 |
| Americans | 0.6 /100 | #264 | Tragic $39,039 |
| Spanish Americans | 0.5 /100 | #265 | Tragic $39,012 |
| Salvadorans | 0.5 /100 | #266 | Tragic $38,858 |
| Immigrants | Zaire | 0.4 /100 | #267 | Tragic $38,848 |
| Liberians | 0.4 /100 | #268 | Tragic $38,780 |
| Immigrants | Jamaica | 0.4 /100 | #269 | Tragic $38,766 |
| Immigrants | Belize | 0.3 /100 | #270 | Tragic $38,614 |
| Central Americans | 0.3 /100 | #271 | Tragic $38,560 |
| Immigrants | Cabo Verde | 0.3 /100 | #272 | Tragic $38,540 |
Demographics Similar to Czechs by Per Capita Income
In terms of per capita income, the demographic groups most similar to Czechs are Immigrants from Armenia ($44,552, a difference of 0.10%), Korean ($44,522, a difference of 0.16%), Irish ($44,679, a difference of 0.19%), Immigrants from Eritrea ($44,509, a difference of 0.19%), and Norwegian ($44,480, a difference of 0.26%).
| Demographics | Rating | Rank | Per Capita Income |
| Immigrants | Jordan | 82.9 /100 | #140 | Excellent $45,066 |
| Slavs | 82.6 /100 | #141 | Excellent $45,049 |
| Ugandans | 82.6 /100 | #142 | Excellent $45,047 |
| Immigrants | Uganda | 82.5 /100 | #143 | Excellent $45,043 |
| Icelanders | 81.6 /100 | #144 | Excellent $44,987 |
| Immigrants | Afghanistan | 78.0 /100 | #145 | Good $44,790 |
| Irish | 75.8 /100 | #146 | Good $44,679 |
| Czechs | 74.1 /100 | #147 | Good $44,595 |
| Immigrants | Armenia | 73.1 /100 | #148 | Good $44,552 |
| Koreans | 72.5 /100 | #149 | Good $44,522 |
| Immigrants | Eritrea | 72.1 /100 | #150 | Good $44,509 |
| Norwegians | 71.5 /100 | #151 | Good $44,480 |
| Peruvians | 71.5 /100 | #152 | Good $44,479 |
| Scottish | 70.6 /100 | #153 | Good $44,440 |
| Portuguese | 68.7 /100 | #154 | Good $44,362 |