Lebanese vs Czech 4 or more Vehicles in Household
COMPARE
Lebanese
Czech
4 or more Vehicles in Household
4 or more Vehicles in Household Comparison
Lebanese
Czechs
6.4%
4 OR MORE VEHICLES IN HOUSEHOLD
55.8/ 100
METRIC RATING
168th/ 347
METRIC RANK
7.4%
4 OR MORE VEHICLES IN HOUSEHOLD
99.8/ 100
METRIC RATING
79th/ 347
METRIC RANK
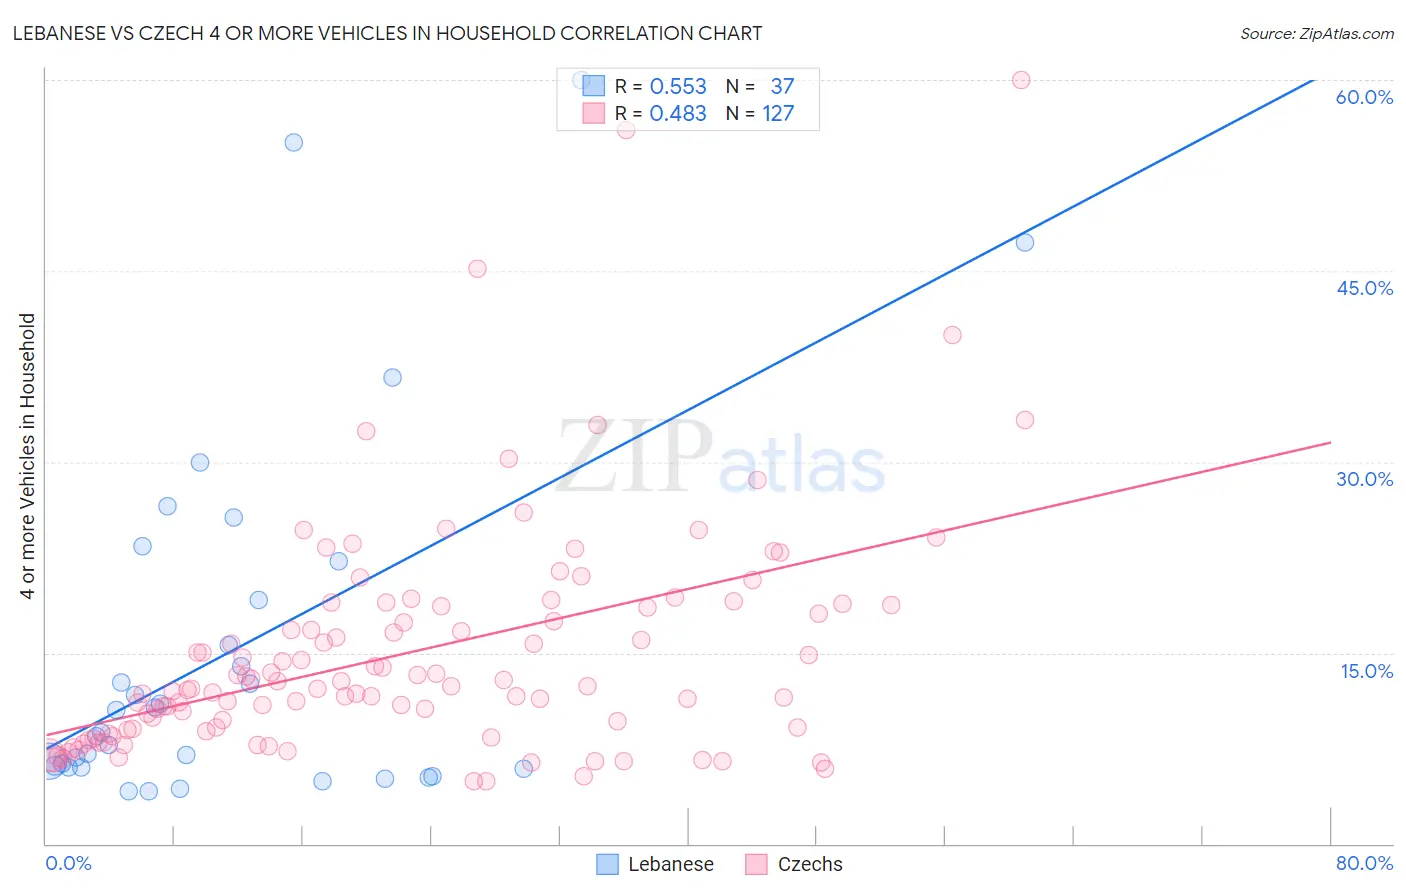
Lebanese vs Czech 4 or more Vehicles in Household Correlation Chart
The statistical analysis conducted on geographies consisting of 399,865,958 people shows a substantial positive correlation between the proportion of Lebanese and percentage of households with 4 or more vehicles available in the United States with a correlation coefficient (R) of 0.553 and weighted average of 6.4%. Similarly, the statistical analysis conducted on geographies consisting of 482,666,265 people shows a moderate positive correlation between the proportion of Czechs and percentage of households with 4 or more vehicles available in the United States with a correlation coefficient (R) of 0.483 and weighted average of 7.4%, a difference of 15.5%.
4 or more Vehicles in Household Correlation Summary
| Measurement | Lebanese | Czech |
| Minimum | 4.1% | 4.9% |
| Maximum | 60.0% | 60.0% |
| Range | 55.9% | 55.1% |
| Mean | 15.1% | 14.9% |
| Median | 8.8% | 12.3% |
| Interquartile 25% (IQ1) | 6.0% | 8.9% |
| Interquartile 75% (IQ3) | 20.7% | 18.6% |
| Interquartile Range (IQR) | 14.7% | 9.8% |
| Standard Deviation (Sample) | 14.3% | 9.1% |
| Standard Deviation (Population) | 14.1% | 9.0% |
Similar Demographics by 4 or more Vehicles in Household
Demographics Similar to Lebanese by 4 or more Vehicles in Household
In terms of 4 or more vehicles in household, the demographic groups most similar to Lebanese are Estonian (6.4%, a difference of 0.070%), Polish (6.4%, a difference of 0.11%), Immigrants from Denmark (6.4%, a difference of 0.20%), Immigrants from Syria (6.3%, a difference of 0.31%), and Immigrants from India (6.3%, a difference of 0.40%).
| Demographics | Rating | Rank | 4 or more Vehicles in Household |
| Immigrants | Cameroon | 64.4 /100 | #161 | Good 6.4% |
| Immigrants | Pakistan | 63.2 /100 | #162 | Good 6.4% |
| Chileans | 61.2 /100 | #163 | Good 6.4% |
| Hungarians | 61.1 /100 | #164 | Good 6.4% |
| Immigrants | Peru | 59.8 /100 | #165 | Average 6.4% |
| Immigrants | Denmark | 57.8 /100 | #166 | Average 6.4% |
| Poles | 56.9 /100 | #167 | Average 6.4% |
| Lebanese | 55.8 /100 | #168 | Average 6.4% |
| Estonians | 55.1 /100 | #169 | Average 6.4% |
| Immigrants | Syria | 52.8 /100 | #170 | Average 6.3% |
| Immigrants | India | 51.9 /100 | #171 | Average 6.3% |
| Immigrants | Lebanon | 51.7 /100 | #172 | Average 6.3% |
| Slovenes | 51.1 /100 | #173 | Average 6.3% |
| Lithuanians | 50.0 /100 | #174 | Average 6.3% |
| Immigrants | Western Europe | 48.8 /100 | #175 | Average 6.3% |
Demographics Similar to Czechs by 4 or more Vehicles in Household
In terms of 4 or more vehicles in household, the demographic groups most similar to Czechs are Alaska Native (7.3%, a difference of 0.14%), White/Caucasian (7.4%, a difference of 0.17%), Apache (7.4%, a difference of 0.24%), Laotian (7.4%, a difference of 0.41%), and Icelander (7.4%, a difference of 0.46%).
| Demographics | Rating | Rank | 4 or more Vehicles in Household |
| Scotch-Irish | 99.9 /100 | #72 | Exceptional 7.4% |
| Portuguese | 99.9 /100 | #73 | Exceptional 7.4% |
| Icelanders | 99.9 /100 | #74 | Exceptional 7.4% |
| Immigrants | Cambodia | 99.9 /100 | #75 | Exceptional 7.4% |
| Laotians | 99.9 /100 | #76 | Exceptional 7.4% |
| Apache | 99.9 /100 | #77 | Exceptional 7.4% |
| Whites/Caucasians | 99.8 /100 | #78 | Exceptional 7.4% |
| Czechs | 99.8 /100 | #79 | Exceptional 7.4% |
| Alaska Natives | 99.8 /100 | #80 | Exceptional 7.3% |
| Finns | 99.8 /100 | #81 | Exceptional 7.3% |
| Northern Europeans | 99.8 /100 | #82 | Exceptional 7.3% |
| Potawatomi | 99.7 /100 | #83 | Exceptional 7.3% |
| Afghans | 99.7 /100 | #84 | Exceptional 7.3% |
| Cree | 99.7 /100 | #85 | Exceptional 7.2% |
| Immigrants | Indonesia | 99.6 /100 | #86 | Exceptional 7.2% |