Lebanese vs Immigrants from Vietnam Per Capita Income
COMPARE
Lebanese
Immigrants from Vietnam
Per Capita Income
Per Capita Income Comparison
Lebanese
Immigrants from Vietnam
$45,840
PER CAPITA INCOME
92.0/ 100
METRIC RATING
123rd/ 347
METRIC RANK
$43,229
PER CAPITA INCOME
38.1/ 100
METRIC RATING
182nd/ 347
METRIC RANK
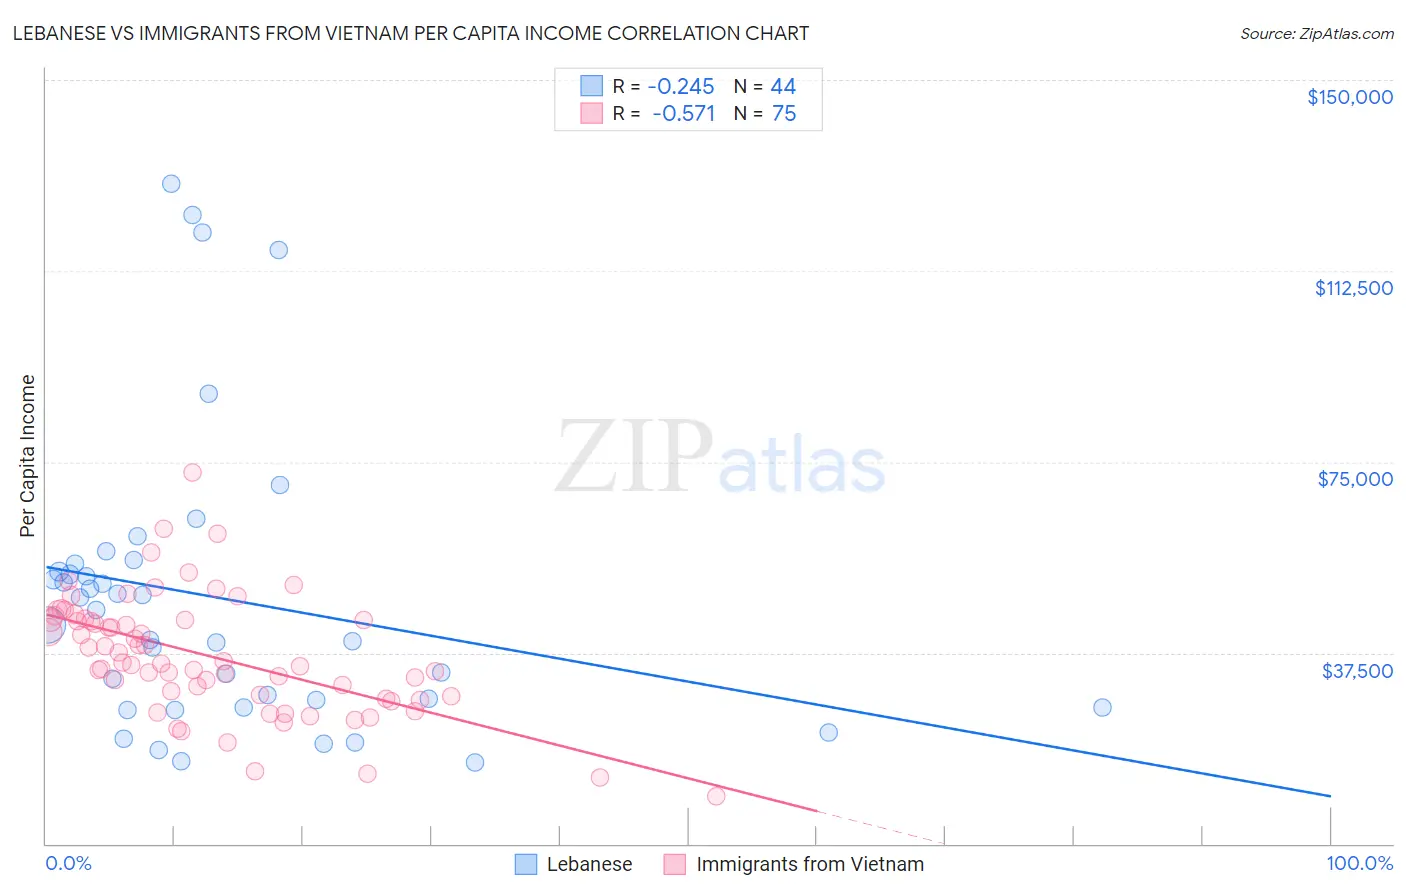
Lebanese vs Immigrants from Vietnam Per Capita Income Correlation Chart
The statistical analysis conducted on geographies consisting of 401,645,404 people shows a weak negative correlation between the proportion of Lebanese and per capita income in the United States with a correlation coefficient (R) of -0.245 and weighted average of $45,840. Similarly, the statistical analysis conducted on geographies consisting of 404,854,816 people shows a substantial negative correlation between the proportion of Immigrants from Vietnam and per capita income in the United States with a correlation coefficient (R) of -0.571 and weighted average of $43,229, a difference of 6.0%.
Per Capita Income Correlation Summary
| Measurement | Lebanese | Immigrants from Vietnam |
| Minimum | $15,839 | $9,224 |
| Maximum | $129,581 | $72,882 |
| Range | $113,742 | $63,658 |
| Mean | $48,201 | $36,916 |
| Median | $44,395 | $35,508 |
| Interquartile 25% (IQ1) | $27,415 | $29,060 |
| Interquartile 75% (IQ3) | $54,286 | $44,032 |
| Interquartile Range (IQR) | $26,871 | $14,972 |
| Standard Deviation (Sample) | $28,531 | $11,678 |
| Standard Deviation (Population) | $28,205 | $11,600 |
Similar Demographics by Per Capita Income
Demographics Similar to Lebanese by Per Capita Income
In terms of per capita income, the demographic groups most similar to Lebanese are European ($45,836, a difference of 0.010%), Moroccan ($45,854, a difference of 0.030%), Canadian ($45,858, a difference of 0.040%), Zimbabwean ($45,804, a difference of 0.080%), and Palestinian ($45,790, a difference of 0.11%).
| Demographics | Rating | Rank | Per Capita Income |
| Poles | 94.1 /100 | #116 | Exceptional $46,123 |
| Chinese | 93.9 /100 | #117 | Exceptional $46,098 |
| Immigrants | Saudi Arabia | 93.3 /100 | #118 | Exceptional $46,008 |
| Immigrants | Poland | 93.1 /100 | #119 | Exceptional $45,979 |
| Immigrants | Ethiopia | 92.7 /100 | #120 | Exceptional $45,923 |
| Canadians | 92.2 /100 | #121 | Exceptional $45,858 |
| Moroccans | 92.1 /100 | #122 | Exceptional $45,854 |
| Lebanese | 92.0 /100 | #123 | Exceptional $45,840 |
| Europeans | 92.0 /100 | #124 | Exceptional $45,836 |
| Zimbabweans | 91.7 /100 | #125 | Exceptional $45,804 |
| Palestinians | 91.6 /100 | #126 | Exceptional $45,790 |
| Immigrants | Germany | 91.3 /100 | #127 | Exceptional $45,751 |
| Swedes | 91.3 /100 | #128 | Exceptional $45,750 |
| Luxembourgers | 90.4 /100 | #129 | Exceptional $45,663 |
| Arabs | 90.4 /100 | #130 | Exceptional $45,662 |
Demographics Similar to Immigrants from Vietnam by Per Capita Income
In terms of per capita income, the demographic groups most similar to Immigrants from Vietnam are Welsh ($43,233, a difference of 0.010%), German ($43,067, a difference of 0.38%), Sierra Leonean ($43,405, a difference of 0.41%), Spaniard ($43,028, a difference of 0.47%), and Immigrants ($43,010, a difference of 0.51%).
| Demographics | Rating | Rank | Per Capita Income |
| Celtics | 48.9 /100 | #175 | Average $43,621 |
| Immigrants | South Eastern Asia | 46.6 /100 | #176 | Average $43,539 |
| Tlingit-Haida | 45.9 /100 | #177 | Average $43,516 |
| Immigrants | Costa Rica | 44.5 /100 | #178 | Average $43,464 |
| Finns | 44.4 /100 | #179 | Average $43,461 |
| Sierra Leoneans | 42.9 /100 | #180 | Average $43,405 |
| Welsh | 38.2 /100 | #181 | Fair $43,233 |
| Immigrants | Vietnam | 38.1 /100 | #182 | Fair $43,229 |
| Germans | 33.9 /100 | #183 | Fair $43,067 |
| Spaniards | 32.9 /100 | #184 | Fair $43,028 |
| Immigrants | Immigrants | 32.5 /100 | #185 | Fair $43,010 |
| French Canadians | 32.3 /100 | #186 | Fair $43,003 |
| Immigrants | Colombia | 31.5 /100 | #187 | Fair $42,971 |
| Immigrants | Africa | 31.0 /100 | #188 | Fair $42,950 |
| Bermudans | 30.1 /100 | #189 | Fair $42,911 |