Japanese vs Immigrants from China Median Female Earnings
COMPARE
Japanese
Immigrants from China
Median Female Earnings
Median Female Earnings Comparison
Japanese
Immigrants from China
$38,528
MEDIAN FEMALE EARNINGS
8.1/ 100
METRIC RATING
222nd/ 347
METRIC RANK
$46,972
MEDIAN FEMALE EARNINGS
100.0/ 100
METRIC RATING
10th/ 347
METRIC RANK
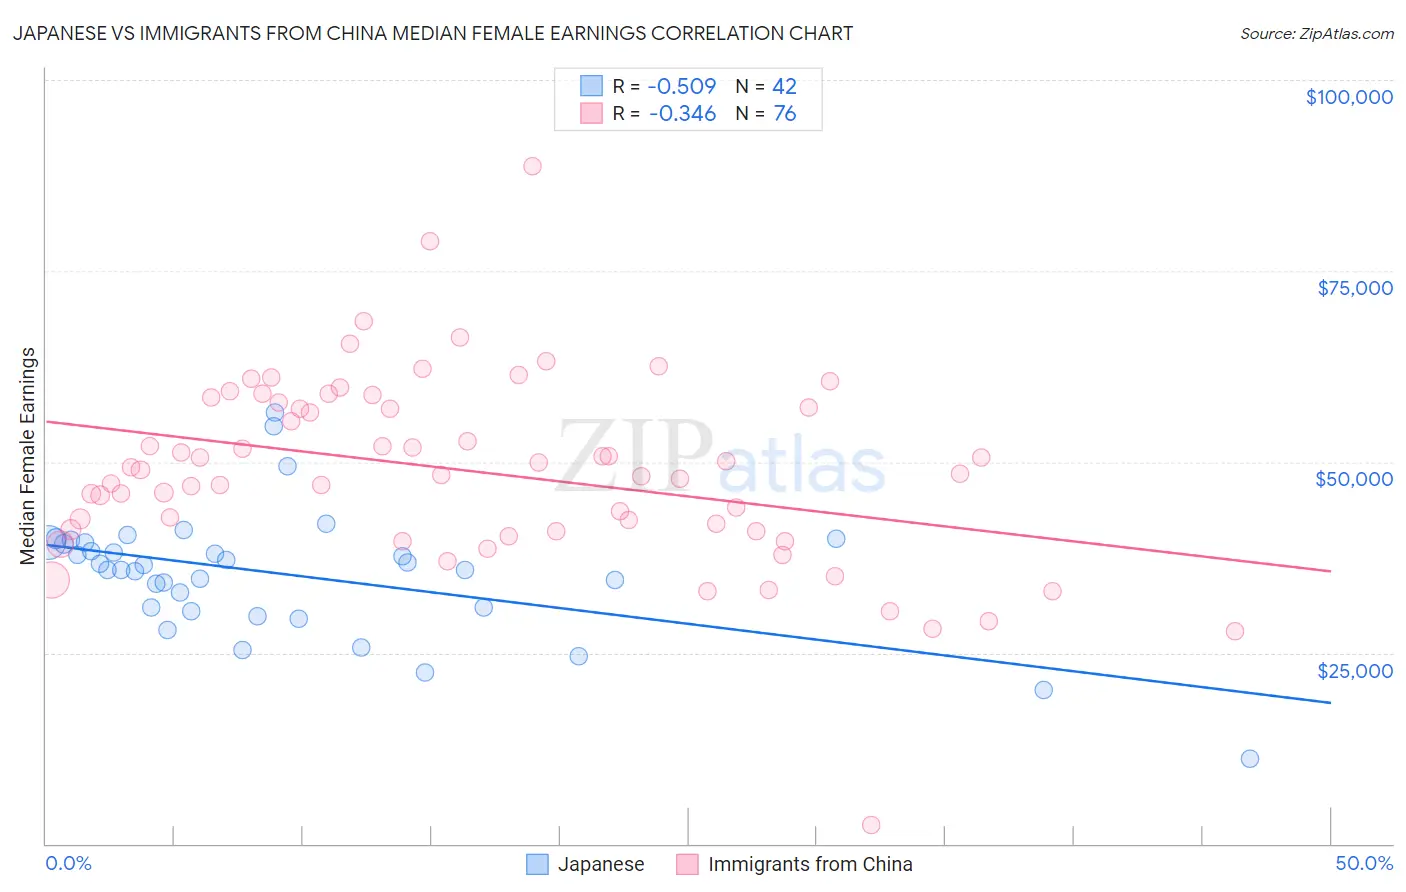
Japanese vs Immigrants from China Median Female Earnings Correlation Chart
The statistical analysis conducted on geographies consisting of 249,158,779 people shows a substantial negative correlation between the proportion of Japanese and median female earnings in the United States with a correlation coefficient (R) of -0.509 and weighted average of $38,528. Similarly, the statistical analysis conducted on geographies consisting of 456,866,400 people shows a mild negative correlation between the proportion of Immigrants from China and median female earnings in the United States with a correlation coefficient (R) of -0.346 and weighted average of $46,972, a difference of 21.9%.
Median Female Earnings Correlation Summary
| Measurement | Japanese | Immigrants from China |
| Minimum | $11,066 | $2,499 |
| Maximum | $56,543 | $88,690 |
| Range | $45,477 | $86,191 |
| Mean | $35,269 | $48,809 |
| Median | $36,190 | $48,719 |
| Interquartile 25% (IQ1) | $30,918 | $41,024 |
| Interquartile 75% (IQ3) | $39,451 | $57,452 |
| Interquartile Range (IQR) | $8,533 | $16,427 |
| Standard Deviation (Sample) | $8,213 | $12,504 |
| Standard Deviation (Population) | $8,115 | $12,421 |
Similar Demographics by Median Female Earnings
Demographics Similar to Japanese by Median Female Earnings
In terms of median female earnings, the demographic groups most similar to Japanese are Immigrants from Sudan ($38,511, a difference of 0.040%), Yugoslavian ($38,573, a difference of 0.12%), Immigrants from the Azores ($38,573, a difference of 0.12%), Native Hawaiian ($38,461, a difference of 0.17%), and Nepalese ($38,603, a difference of 0.19%).
| Demographics | Rating | Rank | Median Female Earnings |
| Spaniards | 10.3 /100 | #215 | Poor $38,656 |
| Immigrants | Ecuador | 10.1 /100 | #216 | Poor $38,644 |
| Immigrants | Jamaica | 9.7 /100 | #217 | Tragic $38,625 |
| Cape Verdeans | 9.5 /100 | #218 | Tragic $38,614 |
| Nepalese | 9.3 /100 | #219 | Tragic $38,603 |
| Yugoslavians | 8.8 /100 | #220 | Tragic $38,573 |
| Immigrants | Azores | 8.8 /100 | #221 | Tragic $38,573 |
| Japanese | 8.1 /100 | #222 | Tragic $38,528 |
| Immigrants | Sudan | 7.8 /100 | #223 | Tragic $38,511 |
| Native Hawaiians | 7.1 /100 | #224 | Tragic $38,461 |
| French | 7.0 /100 | #225 | Tragic $38,457 |
| French Canadians | 6.8 /100 | #226 | Tragic $38,436 |
| Scottish | 6.3 /100 | #227 | Tragic $38,397 |
| Sub-Saharan Africans | 6.2 /100 | #228 | Tragic $38,391 |
| Belgians | 6.1 /100 | #229 | Tragic $38,382 |
Demographics Similar to Immigrants from China by Median Female Earnings
In terms of median female earnings, the demographic groups most similar to Immigrants from China are Okinawan ($46,905, a difference of 0.14%), Immigrants from Israel ($46,902, a difference of 0.15%), Immigrants from Iran ($47,154, a difference of 0.39%), Immigrants from Australia ($46,573, a difference of 0.86%), and Soviet Union ($46,556, a difference of 0.89%).
| Demographics | Rating | Rank | Median Female Earnings |
| Immigrants | Taiwan | 100.0 /100 | #3 | Exceptional $49,256 |
| Immigrants | India | 100.0 /100 | #4 | Exceptional $48,292 |
| Immigrants | Singapore | 100.0 /100 | #5 | Exceptional $47,986 |
| Immigrants | Ireland | 100.0 /100 | #6 | Exceptional $47,598 |
| Thais | 100.0 /100 | #7 | Exceptional $47,577 |
| Iranians | 100.0 /100 | #8 | Exceptional $47,421 |
| Immigrants | Iran | 100.0 /100 | #9 | Exceptional $47,154 |
| Immigrants | China | 100.0 /100 | #10 | Exceptional $46,972 |
| Okinawans | 100.0 /100 | #11 | Exceptional $46,905 |
| Immigrants | Israel | 100.0 /100 | #12 | Exceptional $46,902 |
| Immigrants | Australia | 100.0 /100 | #13 | Exceptional $46,573 |
| Soviet Union | 100.0 /100 | #14 | Exceptional $46,556 |
| Immigrants | Eastern Asia | 100.0 /100 | #15 | Exceptional $46,502 |
| Indians (Asian) | 100.0 /100 | #16 | Exceptional $46,481 |
| Immigrants | South Central Asia | 100.0 /100 | #17 | Exceptional $46,324 |