Japanese vs Nigerian Median Female Earnings
COMPARE
Japanese
Nigerian
Median Female Earnings
Median Female Earnings Comparison
Japanese
Nigerians
$38,528
MEDIAN FEMALE EARNINGS
8.1/ 100
METRIC RATING
222nd/ 347
METRIC RANK
$39,641
MEDIAN FEMALE EARNINGS
47.0/ 100
METRIC RATING
176th/ 347
METRIC RANK
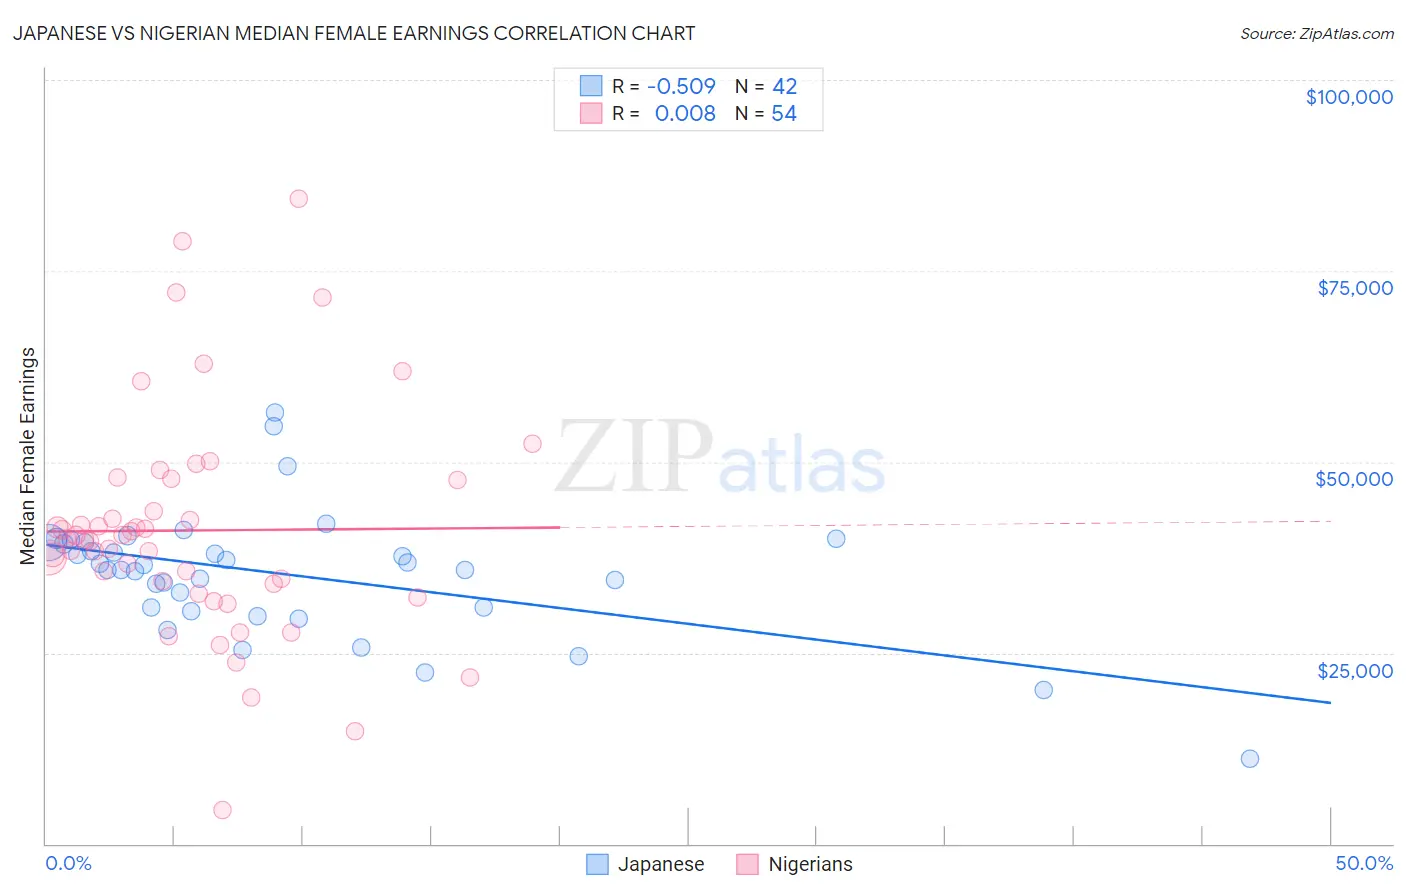
Japanese vs Nigerian Median Female Earnings Correlation Chart
The statistical analysis conducted on geographies consisting of 249,158,779 people shows a substantial negative correlation between the proportion of Japanese and median female earnings in the United States with a correlation coefficient (R) of -0.509 and weighted average of $38,528. Similarly, the statistical analysis conducted on geographies consisting of 332,727,329 people shows no correlation between the proportion of Nigerians and median female earnings in the United States with a correlation coefficient (R) of 0.008 and weighted average of $39,641, a difference of 2.9%.
Median Female Earnings Correlation Summary
| Measurement | Japanese | Nigerian |
| Minimum | $11,066 | $4,391 |
| Maximum | $56,543 | $84,500 |
| Range | $45,477 | $80,109 |
| Mean | $35,269 | $41,029 |
| Median | $36,190 | $39,924 |
| Interquartile 25% (IQ1) | $30,918 | $33,961 |
| Interquartile 75% (IQ3) | $39,451 | $47,567 |
| Interquartile Range (IQR) | $8,533 | $13,606 |
| Standard Deviation (Sample) | $8,213 | $14,779 |
| Standard Deviation (Population) | $8,115 | $14,642 |
Similar Demographics by Median Female Earnings
Demographics Similar to Japanese by Median Female Earnings
In terms of median female earnings, the demographic groups most similar to Japanese are Immigrants from Sudan ($38,511, a difference of 0.040%), Yugoslavian ($38,573, a difference of 0.12%), Immigrants from the Azores ($38,573, a difference of 0.12%), Native Hawaiian ($38,461, a difference of 0.17%), and Nepalese ($38,603, a difference of 0.19%).
| Demographics | Rating | Rank | Median Female Earnings |
| Spaniards | 10.3 /100 | #215 | Poor $38,656 |
| Immigrants | Ecuador | 10.1 /100 | #216 | Poor $38,644 |
| Immigrants | Jamaica | 9.7 /100 | #217 | Tragic $38,625 |
| Cape Verdeans | 9.5 /100 | #218 | Tragic $38,614 |
| Nepalese | 9.3 /100 | #219 | Tragic $38,603 |
| Yugoslavians | 8.8 /100 | #220 | Tragic $38,573 |
| Immigrants | Azores | 8.8 /100 | #221 | Tragic $38,573 |
| Japanese | 8.1 /100 | #222 | Tragic $38,528 |
| Immigrants | Sudan | 7.8 /100 | #223 | Tragic $38,511 |
| Native Hawaiians | 7.1 /100 | #224 | Tragic $38,461 |
| French | 7.0 /100 | #225 | Tragic $38,457 |
| French Canadians | 6.8 /100 | #226 | Tragic $38,436 |
| Scottish | 6.3 /100 | #227 | Tragic $38,397 |
| Sub-Saharan Africans | 6.2 /100 | #228 | Tragic $38,391 |
| Belgians | 6.1 /100 | #229 | Tragic $38,382 |
Demographics Similar to Nigerians by Median Female Earnings
In terms of median female earnings, the demographic groups most similar to Nigerians are Immigrants from South America ($39,643, a difference of 0.010%), Costa Rican ($39,622, a difference of 0.050%), Slavic ($39,613, a difference of 0.070%), Immigrants from Germany ($39,603, a difference of 0.10%), and South American ($39,698, a difference of 0.14%).
| Demographics | Rating | Rank | Median Female Earnings |
| Kenyans | 58.4 /100 | #169 | Average $39,860 |
| Slovenes | 56.2 /100 | #170 | Average $39,817 |
| Immigrants | Portugal | 54.7 /100 | #171 | Average $39,788 |
| British | 53.8 /100 | #172 | Average $39,772 |
| Canadians | 51.4 /100 | #173 | Average $39,724 |
| South Americans | 50.0 /100 | #174 | Average $39,698 |
| Immigrants | South America | 47.2 /100 | #175 | Average $39,643 |
| Nigerians | 47.0 /100 | #176 | Average $39,641 |
| Costa Ricans | 46.1 /100 | #177 | Average $39,622 |
| Slavs | 45.6 /100 | #178 | Average $39,613 |
| Immigrants | Germany | 45.1 /100 | #179 | Average $39,603 |
| Immigrants | Kenya | 41.6 /100 | #180 | Average $39,535 |
| Tsimshian | 41.4 /100 | #181 | Average $39,530 |
| Tlingit-Haida | 40.5 /100 | #182 | Average $39,513 |
| Hungarians | 40.3 /100 | #183 | Average $39,510 |