Dutch West Indian vs Apache Median Female Earnings
COMPARE
Dutch West Indian
Apache
Median Female Earnings
Median Female Earnings Comparison
Dutch West Indians
Apache
$34,106
MEDIAN FEMALE EARNINGS
0.0/ 100
METRIC RATING
325th/ 347
METRIC RANK
$34,895
MEDIAN FEMALE EARNINGS
0.0/ 100
METRIC RATING
314th/ 347
METRIC RANK
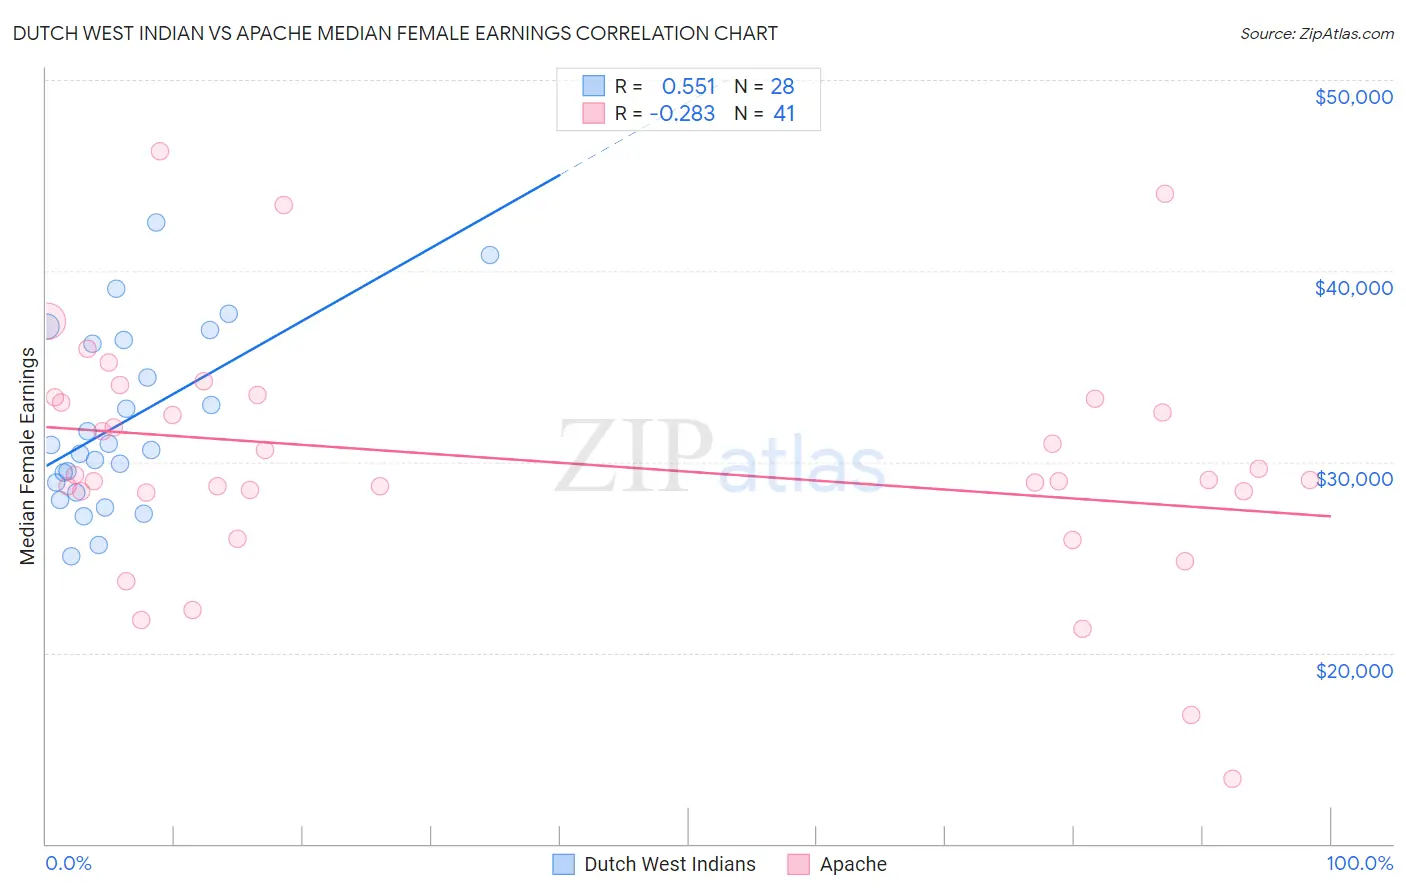
Dutch West Indian vs Apache Median Female Earnings Correlation Chart
The statistical analysis conducted on geographies consisting of 85,733,523 people shows a substantial positive correlation between the proportion of Dutch West Indians and median female earnings in the United States with a correlation coefficient (R) of 0.551 and weighted average of $34,106. Similarly, the statistical analysis conducted on geographies consisting of 230,997,872 people shows a weak negative correlation between the proportion of Apache and median female earnings in the United States with a correlation coefficient (R) of -0.283 and weighted average of $34,895, a difference of 2.3%.
Median Female Earnings Correlation Summary
| Measurement | Dutch West Indian | Apache |
| Minimum | $25,030 | $13,381 |
| Maximum | $42,538 | $46,250 |
| Range | $17,508 | $32,869 |
| Mean | $32,091 | $30,090 |
| Median | $30,746 | $29,044 |
| Interquartile 25% (IQ1) | $28,657 | $28,433 |
| Interquartile 75% (IQ3) | $36,289 | $33,369 |
| Interquartile Range (IQR) | $7,632 | $4,936 |
| Standard Deviation (Sample) | $4,662 | $6,387 |
| Standard Deviation (Population) | $4,578 | $6,309 |
Demographics Similar to Dutch West Indians and Apache by Median Female Earnings
In terms of median female earnings, the demographic groups most similar to Dutch West Indians are Kiowa ($34,074, a difference of 0.090%), Cajun ($34,034, a difference of 0.21%), Immigrants from Central America ($33,953, a difference of 0.45%), Hopi ($33,932, a difference of 0.51%), and Immigrants from Congo ($34,317, a difference of 0.62%). Similarly, the demographic groups most similar to Apache are Cuban ($34,942, a difference of 0.13%), Yaqui ($34,943, a difference of 0.14%), Ute ($34,960, a difference of 0.19%), Pennsylvania German ($34,802, a difference of 0.27%), and Chippewa ($35,003, a difference of 0.31%).
| Demographics | Rating | Rank | Median Female Earnings |
| Hondurans | 0.0 /100 | #309 | Tragic $35,013 |
| Chippewa | 0.0 /100 | #310 | Tragic $35,003 |
| Ute | 0.0 /100 | #311 | Tragic $34,960 |
| Yaqui | 0.0 /100 | #312 | Tragic $34,943 |
| Cubans | 0.0 /100 | #313 | Tragic $34,942 |
| Apache | 0.0 /100 | #314 | Tragic $34,895 |
| Pennsylvania Germans | 0.0 /100 | #315 | Tragic $34,802 |
| Cherokee | 0.0 /100 | #316 | Tragic $34,742 |
| Potawatomi | 0.0 /100 | #317 | Tragic $34,739 |
| Immigrants | Yemen | 0.0 /100 | #318 | Tragic $34,693 |
| Shoshone | 0.0 /100 | #319 | Tragic $34,677 |
| Immigrants | Honduras | 0.0 /100 | #320 | Tragic $34,647 |
| Hispanics or Latinos | 0.0 /100 | #321 | Tragic $34,421 |
| Chickasaw | 0.0 /100 | #322 | Tragic $34,414 |
| Seminole | 0.0 /100 | #323 | Tragic $34,385 |
| Immigrants | Congo | 0.0 /100 | #324 | Tragic $34,317 |
| Dutch West Indians | 0.0 /100 | #325 | Tragic $34,106 |
| Kiowa | 0.0 /100 | #326 | Tragic $34,074 |
| Cajuns | 0.0 /100 | #327 | Tragic $34,034 |
| Immigrants | Central America | 0.0 /100 | #328 | Tragic $33,953 |
| Hopi | 0.0 /100 | #329 | Tragic $33,932 |