Japanese vs Fijian Median Female Earnings
COMPARE
Japanese
Fijian
Median Female Earnings
Median Female Earnings Comparison
Japanese
Fijians
$38,528
MEDIAN FEMALE EARNINGS
8.1/ 100
METRIC RATING
222nd/ 347
METRIC RANK
$35,114
MEDIAN FEMALE EARNINGS
0.0/ 100
METRIC RATING
306th/ 347
METRIC RANK
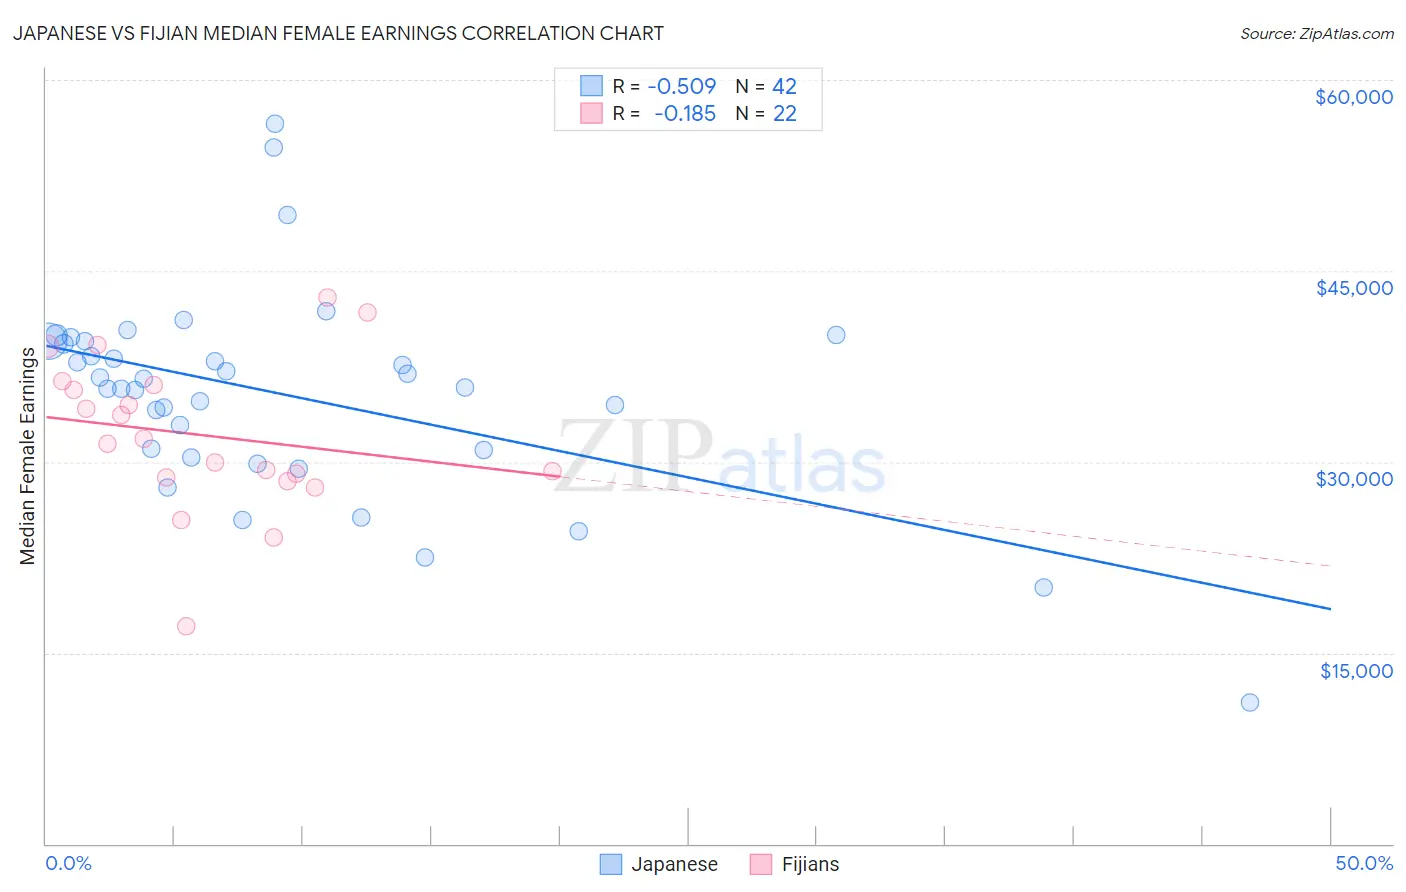
Japanese vs Fijian Median Female Earnings Correlation Chart
The statistical analysis conducted on geographies consisting of 249,158,779 people shows a substantial negative correlation between the proportion of Japanese and median female earnings in the United States with a correlation coefficient (R) of -0.509 and weighted average of $38,528. Similarly, the statistical analysis conducted on geographies consisting of 55,944,407 people shows a poor negative correlation between the proportion of Fijians and median female earnings in the United States with a correlation coefficient (R) of -0.185 and weighted average of $35,114, a difference of 9.7%.
Median Female Earnings Correlation Summary
| Measurement | Japanese | Fijian |
| Minimum | $11,066 | $17,125 |
| Maximum | $56,543 | $42,895 |
| Range | $45,477 | $25,770 |
| Mean | $35,269 | $32,097 |
| Median | $36,190 | $31,625 |
| Interquartile 25% (IQ1) | $30,918 | $28,766 |
| Interquartile 75% (IQ3) | $39,451 | $36,076 |
| Interquartile Range (IQR) | $8,533 | $7,310 |
| Standard Deviation (Sample) | $8,213 | $6,055 |
| Standard Deviation (Population) | $8,115 | $5,916 |
Similar Demographics by Median Female Earnings
Demographics Similar to Japanese by Median Female Earnings
In terms of median female earnings, the demographic groups most similar to Japanese are Immigrants from Sudan ($38,511, a difference of 0.040%), Yugoslavian ($38,573, a difference of 0.12%), Immigrants from the Azores ($38,573, a difference of 0.12%), Native Hawaiian ($38,461, a difference of 0.17%), and Nepalese ($38,603, a difference of 0.19%).
| Demographics | Rating | Rank | Median Female Earnings |
| Spaniards | 10.3 /100 | #215 | Poor $38,656 |
| Immigrants | Ecuador | 10.1 /100 | #216 | Poor $38,644 |
| Immigrants | Jamaica | 9.7 /100 | #217 | Tragic $38,625 |
| Cape Verdeans | 9.5 /100 | #218 | Tragic $38,614 |
| Nepalese | 9.3 /100 | #219 | Tragic $38,603 |
| Yugoslavians | 8.8 /100 | #220 | Tragic $38,573 |
| Immigrants | Azores | 8.8 /100 | #221 | Tragic $38,573 |
| Japanese | 8.1 /100 | #222 | Tragic $38,528 |
| Immigrants | Sudan | 7.8 /100 | #223 | Tragic $38,511 |
| Native Hawaiians | 7.1 /100 | #224 | Tragic $38,461 |
| French | 7.0 /100 | #225 | Tragic $38,457 |
| French Canadians | 6.8 /100 | #226 | Tragic $38,436 |
| Scottish | 6.3 /100 | #227 | Tragic $38,397 |
| Sub-Saharan Africans | 6.2 /100 | #228 | Tragic $38,391 |
| Belgians | 6.1 /100 | #229 | Tragic $38,382 |
Demographics Similar to Fijians by Median Female Earnings
In terms of median female earnings, the demographic groups most similar to Fijians are Bahamian ($35,125, a difference of 0.030%), Sioux ($35,063, a difference of 0.15%), Immigrants from Bahamas ($35,027, a difference of 0.25%), Honduran ($35,013, a difference of 0.29%), and Chippewa ($35,003, a difference of 0.32%).
| Demographics | Rating | Rank | Median Female Earnings |
| Immigrants | Guatemala | 0.0 /100 | #299 | Tragic $35,444 |
| Yuman | 0.0 /100 | #300 | Tragic $35,377 |
| Pima | 0.0 /100 | #301 | Tragic $35,326 |
| Blacks/African Americans | 0.0 /100 | #302 | Tragic $35,315 |
| Immigrants | Latin America | 0.0 /100 | #303 | Tragic $35,307 |
| Crow | 0.0 /100 | #304 | Tragic $35,266 |
| Bahamians | 0.0 /100 | #305 | Tragic $35,125 |
| Fijians | 0.0 /100 | #306 | Tragic $35,114 |
| Sioux | 0.0 /100 | #307 | Tragic $35,063 |
| Immigrants | Bahamas | 0.0 /100 | #308 | Tragic $35,027 |
| Hondurans | 0.0 /100 | #309 | Tragic $35,013 |
| Chippewa | 0.0 /100 | #310 | Tragic $35,003 |
| Ute | 0.0 /100 | #311 | Tragic $34,960 |
| Yaqui | 0.0 /100 | #312 | Tragic $34,943 |
| Cubans | 0.0 /100 | #313 | Tragic $34,942 |