Arapaho vs Apache Median Female Earnings
COMPARE
Arapaho
Apache
Median Female Earnings
Median Female Earnings Comparison
Arapaho
Apache
$31,489
MEDIAN FEMALE EARNINGS
0.0/ 100
METRIC RATING
346th/ 347
METRIC RANK
$34,895
MEDIAN FEMALE EARNINGS
0.0/ 100
METRIC RATING
314th/ 347
METRIC RANK
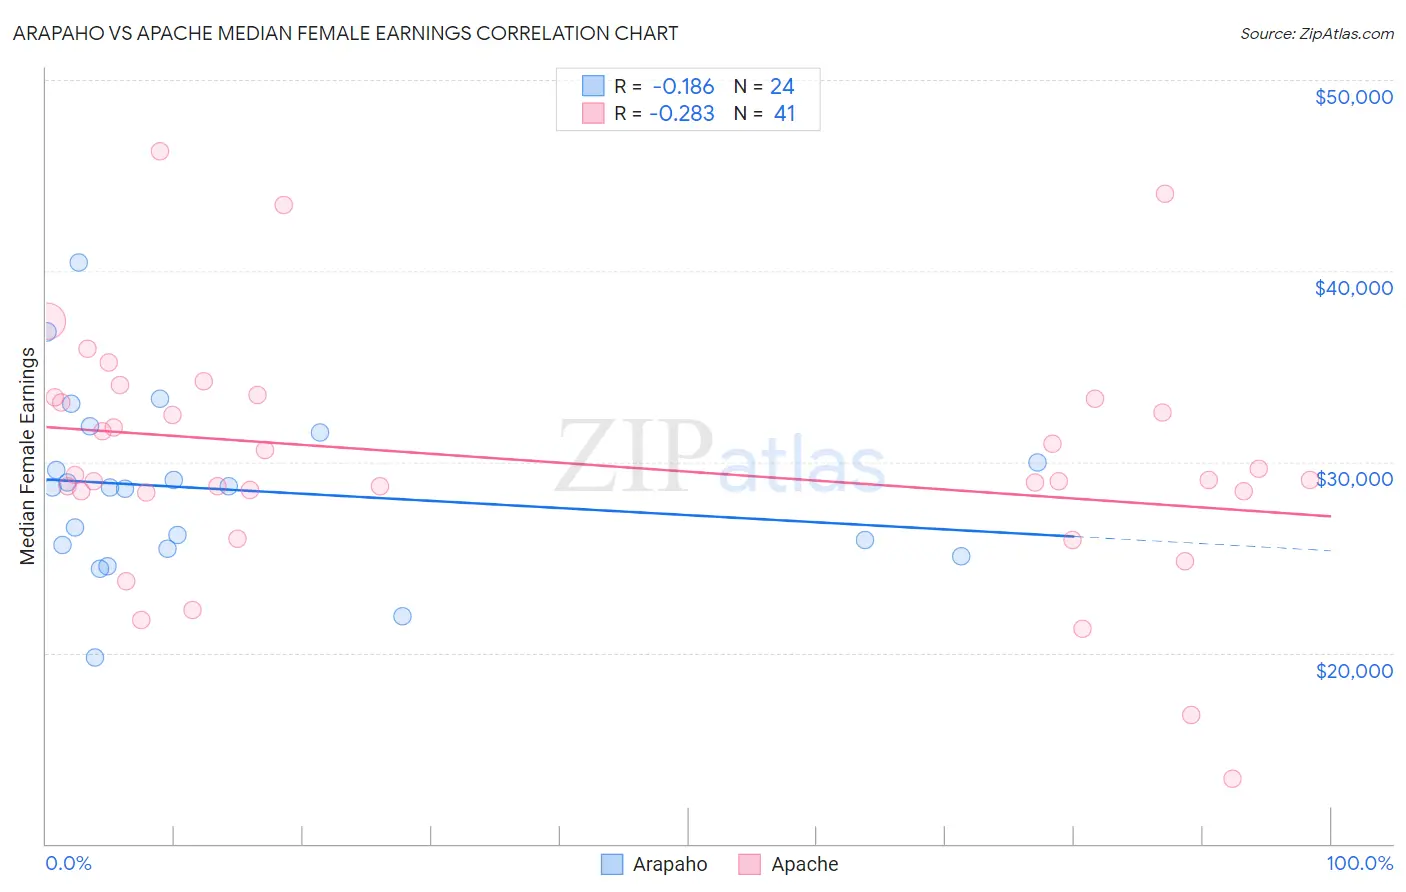
Arapaho vs Apache Median Female Earnings Correlation Chart
The statistical analysis conducted on geographies consisting of 29,776,290 people shows a poor negative correlation between the proportion of Arapaho and median female earnings in the United States with a correlation coefficient (R) of -0.186 and weighted average of $31,489. Similarly, the statistical analysis conducted on geographies consisting of 230,997,872 people shows a weak negative correlation between the proportion of Apache and median female earnings in the United States with a correlation coefficient (R) of -0.283 and weighted average of $34,895, a difference of 10.8%.
Median Female Earnings Correlation Summary
| Measurement | Arapaho | Apache |
| Minimum | $19,750 | $13,381 |
| Maximum | $40,452 | $46,250 |
| Range | $20,702 | $32,869 |
| Mean | $28,528 | $30,090 |
| Median | $28,660 | $29,044 |
| Interquartile 25% (IQ1) | $25,558 | $28,433 |
| Interquartile 75% (IQ3) | $30,782 | $33,369 |
| Interquartile Range (IQR) | $5,224 | $4,936 |
| Standard Deviation (Sample) | $4,555 | $6,387 |
| Standard Deviation (Population) | $4,459 | $6,309 |
Similar Demographics by Median Female Earnings
Demographics Similar to Arapaho by Median Female Earnings
In terms of median female earnings, the demographic groups most similar to Arapaho are Puerto Rican ($31,560, a difference of 0.23%), Lumbee ($32,500, a difference of 3.2%), Pueblo ($32,564, a difference of 3.4%), Houma ($30,343, a difference of 3.8%), and Yup'ik ($32,730, a difference of 3.9%).
| Demographics | Rating | Rank | Median Female Earnings |
| Mexicans | 0.0 /100 | #333 | Tragic $33,664 |
| Spanish American Indians | 0.0 /100 | #334 | Tragic $33,625 |
| Creek | 0.0 /100 | #335 | Tragic $33,437 |
| Ottawa | 0.0 /100 | #336 | Tragic $33,378 |
| Yakama | 0.0 /100 | #337 | Tragic $33,354 |
| Immigrants | Cuba | 0.0 /100 | #338 | Tragic $33,291 |
| Immigrants | Mexico | 0.0 /100 | #339 | Tragic $33,236 |
| Tohono O'odham | 0.0 /100 | #340 | Tragic $33,205 |
| Navajo | 0.0 /100 | #341 | Tragic $33,046 |
| Yup'ik | 0.0 /100 | #342 | Tragic $32,730 |
| Pueblo | 0.0 /100 | #343 | Tragic $32,564 |
| Lumbee | 0.0 /100 | #344 | Tragic $32,500 |
| Puerto Ricans | 0.0 /100 | #345 | Tragic $31,560 |
| Arapaho | 0.0 /100 | #346 | Tragic $31,489 |
| Houma | 0.0 /100 | #347 | Tragic $30,343 |
Demographics Similar to Apache by Median Female Earnings
In terms of median female earnings, the demographic groups most similar to Apache are Cuban ($34,942, a difference of 0.13%), Yaqui ($34,943, a difference of 0.14%), Ute ($34,960, a difference of 0.19%), Pennsylvania German ($34,802, a difference of 0.27%), and Chippewa ($35,003, a difference of 0.31%).
| Demographics | Rating | Rank | Median Female Earnings |
| Sioux | 0.0 /100 | #307 | Tragic $35,063 |
| Immigrants | Bahamas | 0.0 /100 | #308 | Tragic $35,027 |
| Hondurans | 0.0 /100 | #309 | Tragic $35,013 |
| Chippewa | 0.0 /100 | #310 | Tragic $35,003 |
| Ute | 0.0 /100 | #311 | Tragic $34,960 |
| Yaqui | 0.0 /100 | #312 | Tragic $34,943 |
| Cubans | 0.0 /100 | #313 | Tragic $34,942 |
| Apache | 0.0 /100 | #314 | Tragic $34,895 |
| Pennsylvania Germans | 0.0 /100 | #315 | Tragic $34,802 |
| Cherokee | 0.0 /100 | #316 | Tragic $34,742 |
| Potawatomi | 0.0 /100 | #317 | Tragic $34,739 |
| Immigrants | Yemen | 0.0 /100 | #318 | Tragic $34,693 |
| Shoshone | 0.0 /100 | #319 | Tragic $34,677 |
| Immigrants | Honduras | 0.0 /100 | #320 | Tragic $34,647 |
| Hispanics or Latinos | 0.0 /100 | #321 | Tragic $34,421 |