Immigrants from Taiwan vs Apache Median Female Earnings
COMPARE
Immigrants from Taiwan
Apache
Median Female Earnings
Median Female Earnings Comparison
Immigrants from Taiwan
Apache
$49,256
MEDIAN FEMALE EARNINGS
100.0/ 100
METRIC RATING
3rd/ 347
METRIC RANK
$34,895
MEDIAN FEMALE EARNINGS
0.0/ 100
METRIC RATING
314th/ 347
METRIC RANK
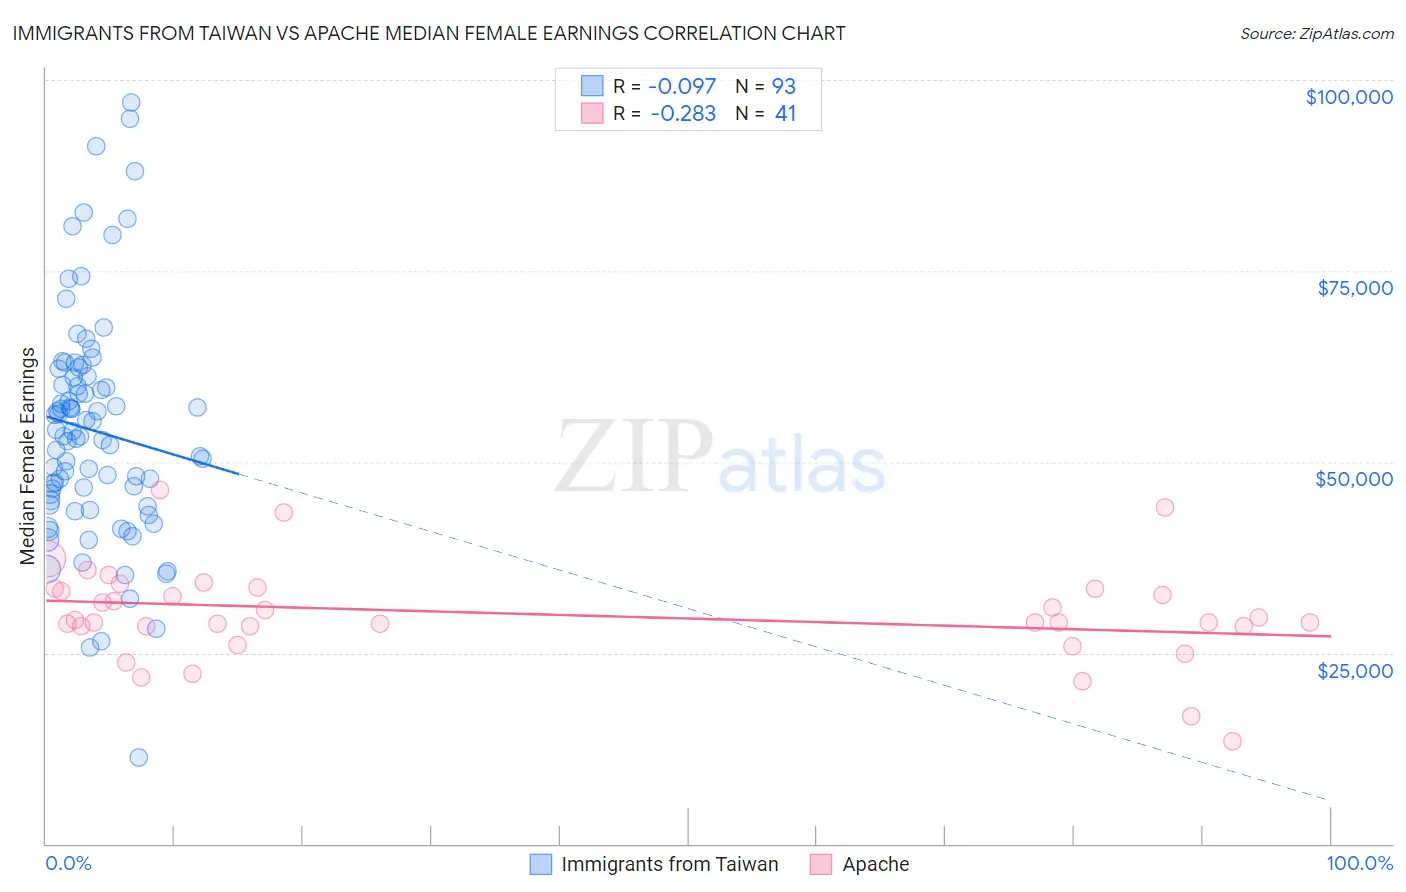
Immigrants from Taiwan vs Apache Median Female Earnings Correlation Chart
The statistical analysis conducted on geographies consisting of 298,206,550 people shows a slight negative correlation between the proportion of Immigrants from Taiwan and median female earnings in the United States with a correlation coefficient (R) of -0.097 and weighted average of $49,256. Similarly, the statistical analysis conducted on geographies consisting of 230,997,872 people shows a weak negative correlation between the proportion of Apache and median female earnings in the United States with a correlation coefficient (R) of -0.283 and weighted average of $34,895, a difference of 41.1%.
Median Female Earnings Correlation Summary
| Measurement | Immigrants from Taiwan | Apache |
| Minimum | $11,250 | $13,381 |
| Maximum | $97,064 | $46,250 |
| Range | $85,814 | $32,869 |
| Mean | $54,143 | $30,090 |
| Median | $53,398 | $29,044 |
| Interquartile 25% (IQ1) | $44,696 | $28,433 |
| Interquartile 75% (IQ3) | $61,160 | $33,369 |
| Interquartile Range (IQR) | $16,465 | $4,936 |
| Standard Deviation (Sample) | $14,938 | $6,387 |
| Standard Deviation (Population) | $14,857 | $6,309 |
Similar Demographics by Median Female Earnings
Demographics Similar to Immigrants from Taiwan by Median Female Earnings
In terms of median female earnings, the demographic groups most similar to Immigrants from Taiwan are Filipino ($49,508, a difference of 0.51%), Immigrants from Hong Kong ($49,818, a difference of 1.1%), Immigrants from India ($48,292, a difference of 2.0%), Immigrants from Singapore ($47,986, a difference of 2.6%), and Immigrants from Ireland ($47,598, a difference of 3.5%).
| Demographics | Rating | Rank | Median Female Earnings |
| Immigrants | Hong Kong | 100.0 /100 | #1 | Exceptional $49,818 |
| Filipinos | 100.0 /100 | #2 | Exceptional $49,508 |
| Immigrants | Taiwan | 100.0 /100 | #3 | Exceptional $49,256 |
| Immigrants | India | 100.0 /100 | #4 | Exceptional $48,292 |
| Immigrants | Singapore | 100.0 /100 | #5 | Exceptional $47,986 |
| Immigrants | Ireland | 100.0 /100 | #6 | Exceptional $47,598 |
| Thais | 100.0 /100 | #7 | Exceptional $47,577 |
| Iranians | 100.0 /100 | #8 | Exceptional $47,421 |
| Immigrants | Iran | 100.0 /100 | #9 | Exceptional $47,154 |
| Immigrants | China | 100.0 /100 | #10 | Exceptional $46,972 |
| Okinawans | 100.0 /100 | #11 | Exceptional $46,905 |
| Immigrants | Israel | 100.0 /100 | #12 | Exceptional $46,902 |
| Immigrants | Australia | 100.0 /100 | #13 | Exceptional $46,573 |
| Soviet Union | 100.0 /100 | #14 | Exceptional $46,556 |
| Immigrants | Eastern Asia | 100.0 /100 | #15 | Exceptional $46,502 |
Demographics Similar to Apache by Median Female Earnings
In terms of median female earnings, the demographic groups most similar to Apache are Cuban ($34,942, a difference of 0.13%), Yaqui ($34,943, a difference of 0.14%), Ute ($34,960, a difference of 0.19%), Pennsylvania German ($34,802, a difference of 0.27%), and Chippewa ($35,003, a difference of 0.31%).
| Demographics | Rating | Rank | Median Female Earnings |
| Sioux | 0.0 /100 | #307 | Tragic $35,063 |
| Immigrants | Bahamas | 0.0 /100 | #308 | Tragic $35,027 |
| Hondurans | 0.0 /100 | #309 | Tragic $35,013 |
| Chippewa | 0.0 /100 | #310 | Tragic $35,003 |
| Ute | 0.0 /100 | #311 | Tragic $34,960 |
| Yaqui | 0.0 /100 | #312 | Tragic $34,943 |
| Cubans | 0.0 /100 | #313 | Tragic $34,942 |
| Apache | 0.0 /100 | #314 | Tragic $34,895 |
| Pennsylvania Germans | 0.0 /100 | #315 | Tragic $34,802 |
| Cherokee | 0.0 /100 | #316 | Tragic $34,742 |
| Potawatomi | 0.0 /100 | #317 | Tragic $34,739 |
| Immigrants | Yemen | 0.0 /100 | #318 | Tragic $34,693 |
| Shoshone | 0.0 /100 | #319 | Tragic $34,677 |
| Immigrants | Honduras | 0.0 /100 | #320 | Tragic $34,647 |
| Hispanics or Latinos | 0.0 /100 | #321 | Tragic $34,421 |