Yaqui vs Apache Median Female Earnings
COMPARE
Yaqui
Apache
Median Female Earnings
Median Female Earnings Comparison
Yaqui
Apache
$34,943
MEDIAN FEMALE EARNINGS
0.0/ 100
METRIC RATING
312th/ 347
METRIC RANK
$34,895
MEDIAN FEMALE EARNINGS
0.0/ 100
METRIC RATING
314th/ 347
METRIC RANK
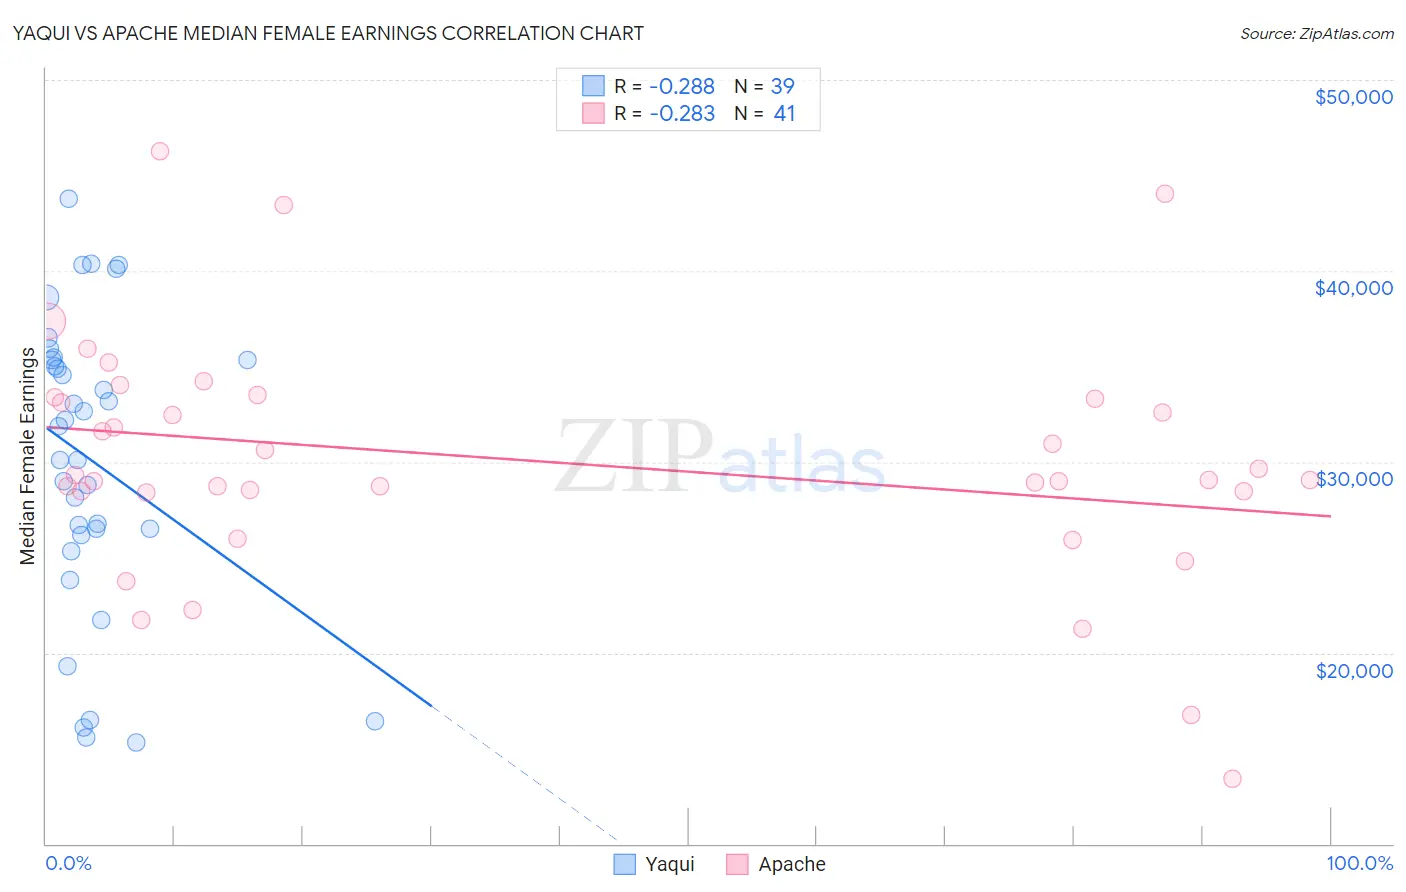
Yaqui vs Apache Median Female Earnings Correlation Chart
The statistical analysis conducted on geographies consisting of 107,698,351 people shows a weak negative correlation between the proportion of Yaqui and median female earnings in the United States with a correlation coefficient (R) of -0.288 and weighted average of $34,943. Similarly, the statistical analysis conducted on geographies consisting of 230,997,872 people shows a weak negative correlation between the proportion of Apache and median female earnings in the United States with a correlation coefficient (R) of -0.283 and weighted average of $34,895, a difference of 0.14%.
Median Female Earnings Correlation Summary
| Measurement | Yaqui | Apache |
| Minimum | $15,284 | $13,381 |
| Maximum | $43,787 | $46,250 |
| Range | $28,503 | $32,869 |
| Mean | $30,052 | $30,090 |
| Median | $31,854 | $29,044 |
| Interquartile 25% (IQ1) | $26,190 | $28,433 |
| Interquartile 75% (IQ3) | $35,336 | $33,369 |
| Interquartile Range (IQR) | $9,146 | $4,936 |
| Standard Deviation (Sample) | $7,719 | $6,387 |
| Standard Deviation (Population) | $7,619 | $6,309 |
Demographics Similar to Yaqui and Apache by Median Female Earnings
In terms of median female earnings, the demographic groups most similar to Yaqui are Cuban ($34,942, a difference of 0.0%), Ute ($34,960, a difference of 0.050%), Chippewa ($35,003, a difference of 0.17%), Honduran ($35,013, a difference of 0.20%), and Immigrants from Bahamas ($35,027, a difference of 0.24%). Similarly, the demographic groups most similar to Apache are Cuban ($34,942, a difference of 0.13%), Ute ($34,960, a difference of 0.19%), Pennsylvania German ($34,802, a difference of 0.27%), Chippewa ($35,003, a difference of 0.31%), and Honduran ($35,013, a difference of 0.34%).
| Demographics | Rating | Rank | Median Female Earnings |
| Immigrants | Latin America | 0.0 /100 | #303 | Tragic $35,307 |
| Crow | 0.0 /100 | #304 | Tragic $35,266 |
| Bahamians | 0.0 /100 | #305 | Tragic $35,125 |
| Fijians | 0.0 /100 | #306 | Tragic $35,114 |
| Sioux | 0.0 /100 | #307 | Tragic $35,063 |
| Immigrants | Bahamas | 0.0 /100 | #308 | Tragic $35,027 |
| Hondurans | 0.0 /100 | #309 | Tragic $35,013 |
| Chippewa | 0.0 /100 | #310 | Tragic $35,003 |
| Ute | 0.0 /100 | #311 | Tragic $34,960 |
| Yaqui | 0.0 /100 | #312 | Tragic $34,943 |
| Cubans | 0.0 /100 | #313 | Tragic $34,942 |
| Apache | 0.0 /100 | #314 | Tragic $34,895 |
| Pennsylvania Germans | 0.0 /100 | #315 | Tragic $34,802 |
| Cherokee | 0.0 /100 | #316 | Tragic $34,742 |
| Potawatomi | 0.0 /100 | #317 | Tragic $34,739 |
| Immigrants | Yemen | 0.0 /100 | #318 | Tragic $34,693 |
| Shoshone | 0.0 /100 | #319 | Tragic $34,677 |
| Immigrants | Honduras | 0.0 /100 | #320 | Tragic $34,647 |
| Hispanics or Latinos | 0.0 /100 | #321 | Tragic $34,421 |
| Chickasaw | 0.0 /100 | #322 | Tragic $34,414 |
| Seminole | 0.0 /100 | #323 | Tragic $34,385 |