Immigrants from Eastern Asia vs Mongolian Median Family Income
COMPARE
Immigrants from Eastern Asia
Mongolian
Median Family Income
Median Family Income Comparison
Immigrants from Eastern Asia
Mongolians
$125,150
MEDIAN FAMILY INCOME
100.0/ 100
METRIC RATING
18th/ 347
METRIC RANK
$114,553
MEDIAN FAMILY INCOME
99.8/ 100
METRIC RATING
62nd/ 347
METRIC RANK
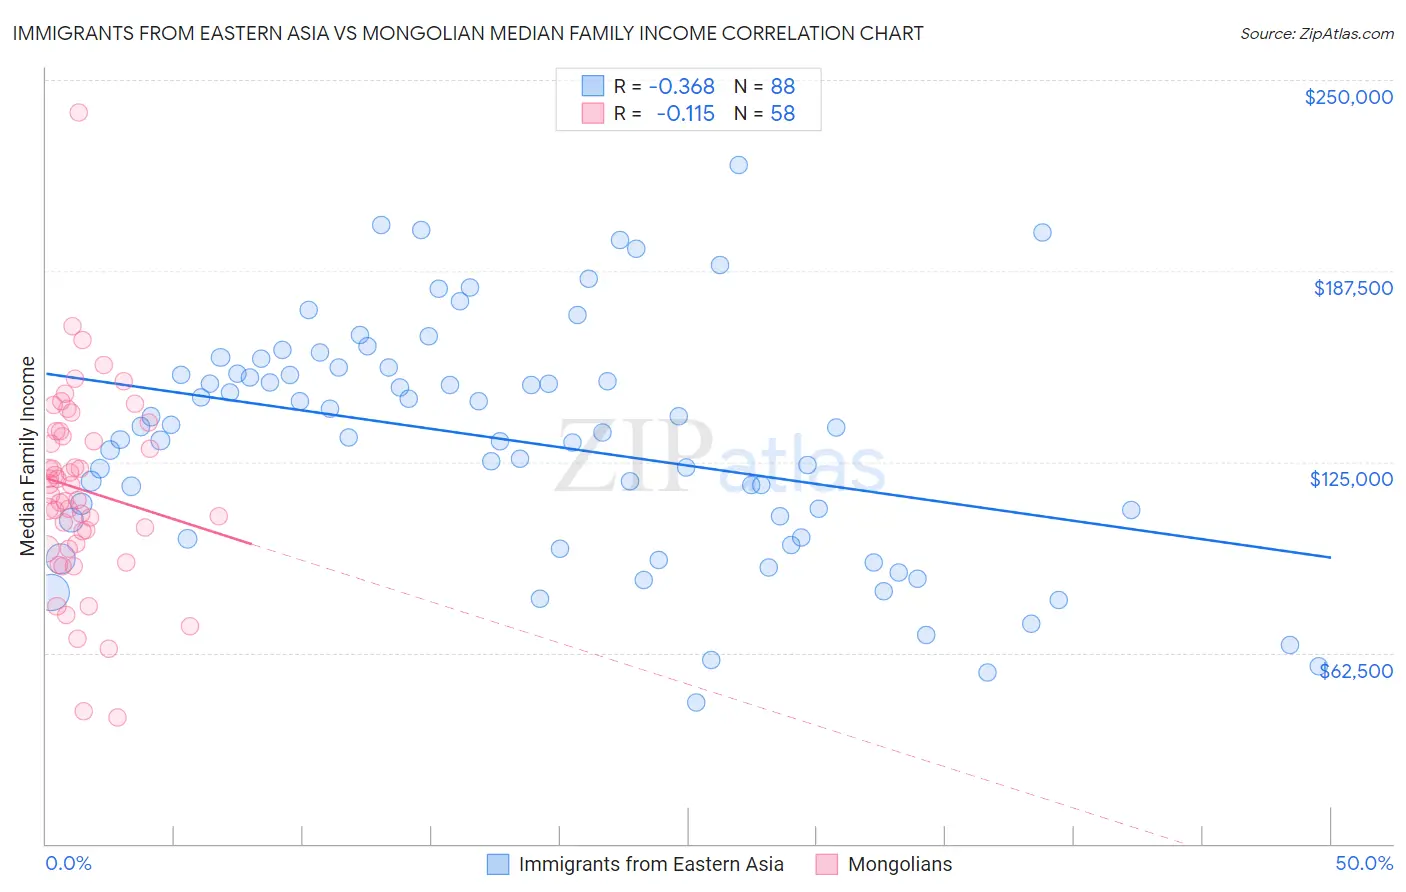
Immigrants from Eastern Asia vs Mongolian Median Family Income Correlation Chart
The statistical analysis conducted on geographies consisting of 499,115,176 people shows a mild negative correlation between the proportion of Immigrants from Eastern Asia and median family income in the United States with a correlation coefficient (R) of -0.368 and weighted average of $125,150. Similarly, the statistical analysis conducted on geographies consisting of 140,257,208 people shows a poor negative correlation between the proportion of Mongolians and median family income in the United States with a correlation coefficient (R) of -0.115 and weighted average of $114,553, a difference of 9.2%.
Median Family Income Correlation Summary
| Measurement | Immigrants from Eastern Asia | Mongolian |
| Minimum | $46,207 | $41,389 |
| Maximum | $222,159 | $239,335 |
| Range | $175,952 | $197,946 |
| Mean | $131,947 | $115,974 |
| Median | $135,368 | $115,745 |
| Interquartile 25% (IQ1) | $103,059 | $98,398 |
| Interquartile 75% (IQ3) | $154,860 | $135,066 |
| Interquartile Range (IQR) | $51,801 | $36,668 |
| Standard Deviation (Sample) | $38,302 | $32,155 |
| Standard Deviation (Population) | $38,084 | $31,876 |
Similar Demographics by Median Family Income
Demographics Similar to Immigrants from Eastern Asia by Median Family Income
In terms of median family income, the demographic groups most similar to Immigrants from Eastern Asia are Indian (Asian) ($125,312, a difference of 0.13%), Immigrants from China ($125,540, a difference of 0.31%), Eastern European ($125,546, a difference of 0.32%), Immigrants from South Central Asia ($125,956, a difference of 0.64%), and Immigrants from Belgium ($123,831, a difference of 1.1%).
| Demographics | Rating | Rank | Median Family Income |
| Immigrants | Israel | 100.0 /100 | #11 | Exceptional $127,430 |
| Cypriots | 100.0 /100 | #12 | Exceptional $127,064 |
| Immigrants | Australia | 100.0 /100 | #13 | Exceptional $126,620 |
| Immigrants | South Central Asia | 100.0 /100 | #14 | Exceptional $125,956 |
| Eastern Europeans | 100.0 /100 | #15 | Exceptional $125,546 |
| Immigrants | China | 100.0 /100 | #16 | Exceptional $125,540 |
| Indians (Asian) | 100.0 /100 | #17 | Exceptional $125,312 |
| Immigrants | Eastern Asia | 100.0 /100 | #18 | Exceptional $125,150 |
| Immigrants | Belgium | 100.0 /100 | #19 | Exceptional $123,831 |
| Burmese | 100.0 /100 | #20 | Exceptional $123,369 |
| Immigrants | Korea | 100.0 /100 | #21 | Exceptional $122,800 |
| Immigrants | Sweden | 100.0 /100 | #22 | Exceptional $122,765 |
| Immigrants | Japan | 100.0 /100 | #23 | Exceptional $122,764 |
| Immigrants | Northern Europe | 100.0 /100 | #24 | Exceptional $121,840 |
| Turks | 100.0 /100 | #25 | Exceptional $121,202 |
Demographics Similar to Mongolians by Median Family Income
In terms of median family income, the demographic groups most similar to Mongolians are Immigrants from Belarus ($114,586, a difference of 0.030%), Immigrants from Pakistan ($114,406, a difference of 0.13%), Immigrants from Scotland ($114,392, a difference of 0.14%), Immigrants from Latvia ($114,826, a difference of 0.24%), and Immigrants from Netherlands ($114,987, a difference of 0.38%).
| Demographics | Rating | Rank | Median Family Income |
| Lithuanians | 99.8 /100 | #55 | Exceptional $115,395 |
| New Zealanders | 99.8 /100 | #56 | Exceptional $115,230 |
| Greeks | 99.8 /100 | #57 | Exceptional $115,192 |
| Immigrants | Indonesia | 99.8 /100 | #58 | Exceptional $115,162 |
| Immigrants | Netherlands | 99.8 /100 | #59 | Exceptional $114,987 |
| Immigrants | Latvia | 99.8 /100 | #60 | Exceptional $114,826 |
| Immigrants | Belarus | 99.8 /100 | #61 | Exceptional $114,586 |
| Mongolians | 99.8 /100 | #62 | Exceptional $114,553 |
| Immigrants | Pakistan | 99.8 /100 | #63 | Exceptional $114,406 |
| Immigrants | Scotland | 99.7 /100 | #64 | Exceptional $114,392 |
| Egyptians | 99.7 /100 | #65 | Exceptional $114,119 |
| Paraguayans | 99.7 /100 | #66 | Exceptional $114,016 |
| Immigrants | Spain | 99.7 /100 | #67 | Exceptional $113,815 |
| Immigrants | Serbia | 99.6 /100 | #68 | Exceptional $113,463 |
| Immigrants | Bulgaria | 99.6 /100 | #69 | Exceptional $113,461 |