Jamaican vs Mongolian Median Male Earnings
COMPARE
Jamaican
Mongolian
Median Male Earnings
Median Male Earnings Comparison
Jamaicans
Mongolians
$48,632
MEDIAN MALE EARNINGS
0.3/ 100
METRIC RATING
273rd/ 347
METRIC RANK
$60,350
MEDIAN MALE EARNINGS
99.7/ 100
METRIC RATING
71st/ 347
METRIC RANK
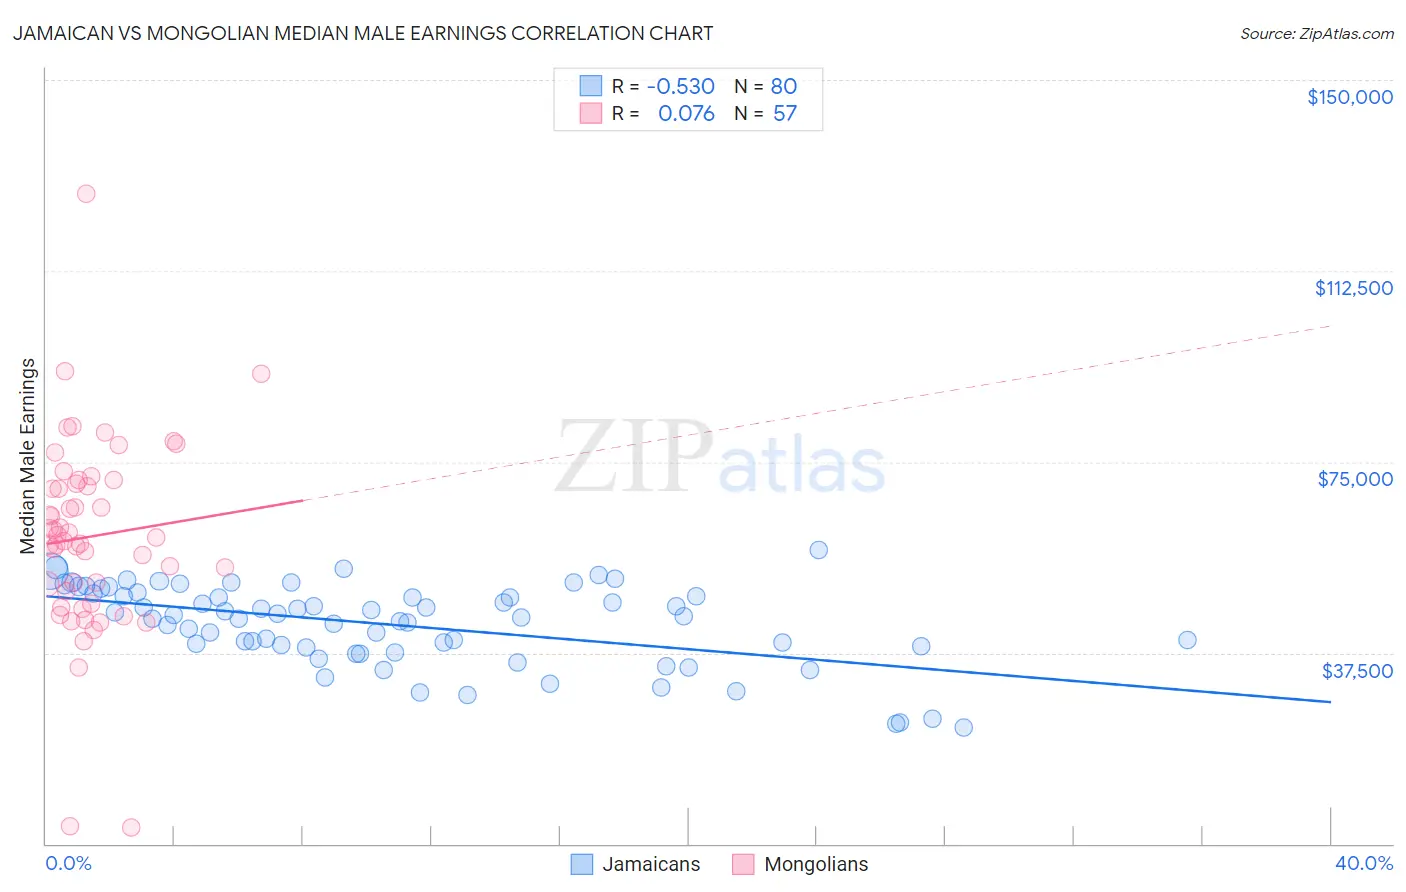
Jamaican vs Mongolian Median Male Earnings Correlation Chart
The statistical analysis conducted on geographies consisting of 367,962,773 people shows a substantial negative correlation between the proportion of Jamaicans and median male earnings in the United States with a correlation coefficient (R) of -0.530 and weighted average of $48,632. Similarly, the statistical analysis conducted on geographies consisting of 140,336,104 people shows a slight positive correlation between the proportion of Mongolians and median male earnings in the United States with a correlation coefficient (R) of 0.076 and weighted average of $60,350, a difference of 24.1%.
Median Male Earnings Correlation Summary
| Measurement | Jamaican | Mongolian |
| Minimum | $22,747 | $3,109 |
| Maximum | $57,769 | $127,545 |
| Range | $35,022 | $124,436 |
| Mean | $42,945 | $60,323 |
| Median | $44,504 | $60,102 |
| Interquartile 25% (IQ1) | $38,662 | $48,308 |
| Interquartile 75% (IQ3) | $48,891 | $71,104 |
| Interquartile Range (IQR) | $10,229 | $22,796 |
| Standard Deviation (Sample) | $7,942 | $19,294 |
| Standard Deviation (Population) | $7,893 | $19,124 |
Similar Demographics by Median Male Earnings
Demographics Similar to Jamaicans by Median Male Earnings
In terms of median male earnings, the demographic groups most similar to Jamaicans are Salvadoran ($48,646, a difference of 0.030%), Cherokee ($48,669, a difference of 0.080%), Colville ($48,516, a difference of 0.24%), Potawatomi ($48,768, a difference of 0.28%), and Immigrants from Somalia ($48,439, a difference of 0.40%).
| Demographics | Rating | Rank | Median Male Earnings |
| Somalis | 0.5 /100 | #266 | Tragic $49,025 |
| Spanish Americans | 0.5 /100 | #267 | Tragic $49,008 |
| Ute | 0.4 /100 | #268 | Tragic $48,899 |
| Tsimshian | 0.4 /100 | #269 | Tragic $48,836 |
| Potawatomi | 0.4 /100 | #270 | Tragic $48,768 |
| Cherokee | 0.3 /100 | #271 | Tragic $48,669 |
| Salvadorans | 0.3 /100 | #272 | Tragic $48,646 |
| Jamaicans | 0.3 /100 | #273 | Tragic $48,632 |
| Colville | 0.3 /100 | #274 | Tragic $48,516 |
| Immigrants | Somalia | 0.3 /100 | #275 | Tragic $48,439 |
| Blackfeet | 0.3 /100 | #276 | Tragic $48,402 |
| Belizeans | 0.2 /100 | #277 | Tragic $48,358 |
| Immigrants | Liberia | 0.2 /100 | #278 | Tragic $48,317 |
| Hmong | 0.2 /100 | #279 | Tragic $48,254 |
| Comanche | 0.2 /100 | #280 | Tragic $48,202 |
Demographics Similar to Mongolians by Median Male Earnings
In terms of median male earnings, the demographic groups most similar to Mongolians are Immigrants from Bulgaria ($60,358, a difference of 0.010%), Immigrants from Western Europe ($60,334, a difference of 0.030%), Immigrants from Canada ($60,388, a difference of 0.060%), Immigrants from North America ($60,265, a difference of 0.14%), and Argentinean ($60,117, a difference of 0.39%).
| Demographics | Rating | Rank | Median Male Earnings |
| Immigrants | Eastern Europe | 99.8 /100 | #64 | Exceptional $60,958 |
| Immigrants | Indonesia | 99.8 /100 | #65 | Exceptional $60,935 |
| Immigrants | Croatia | 99.8 /100 | #66 | Exceptional $60,914 |
| Immigrants | Spain | 99.8 /100 | #67 | Exceptional $60,750 |
| Immigrants | Serbia | 99.7 /100 | #68 | Exceptional $60,600 |
| Immigrants | Canada | 99.7 /100 | #69 | Exceptional $60,388 |
| Immigrants | Bulgaria | 99.7 /100 | #70 | Exceptional $60,358 |
| Mongolians | 99.7 /100 | #71 | Exceptional $60,350 |
| Immigrants | Western Europe | 99.7 /100 | #72 | Exceptional $60,334 |
| Immigrants | North America | 99.7 /100 | #73 | Exceptional $60,265 |
| Argentineans | 99.6 /100 | #74 | Exceptional $60,117 |
| Immigrants | Bolivia | 99.6 /100 | #75 | Exceptional $60,088 |
| Romanians | 99.6 /100 | #76 | Exceptional $60,063 |
| Paraguayans | 99.5 /100 | #77 | Exceptional $59,975 |
| Immigrants | Egypt | 99.5 /100 | #78 | Exceptional $59,925 |