Navajo vs Mongolian Median Family Income
COMPARE
Navajo
Mongolian
Median Family Income
Median Family Income Comparison
Navajo
Mongolians
$70,989
MEDIAN FAMILY INCOME
0.0/ 100
METRIC RATING
345th/ 347
METRIC RANK
$114,553
MEDIAN FAMILY INCOME
99.8/ 100
METRIC RATING
62nd/ 347
METRIC RANK
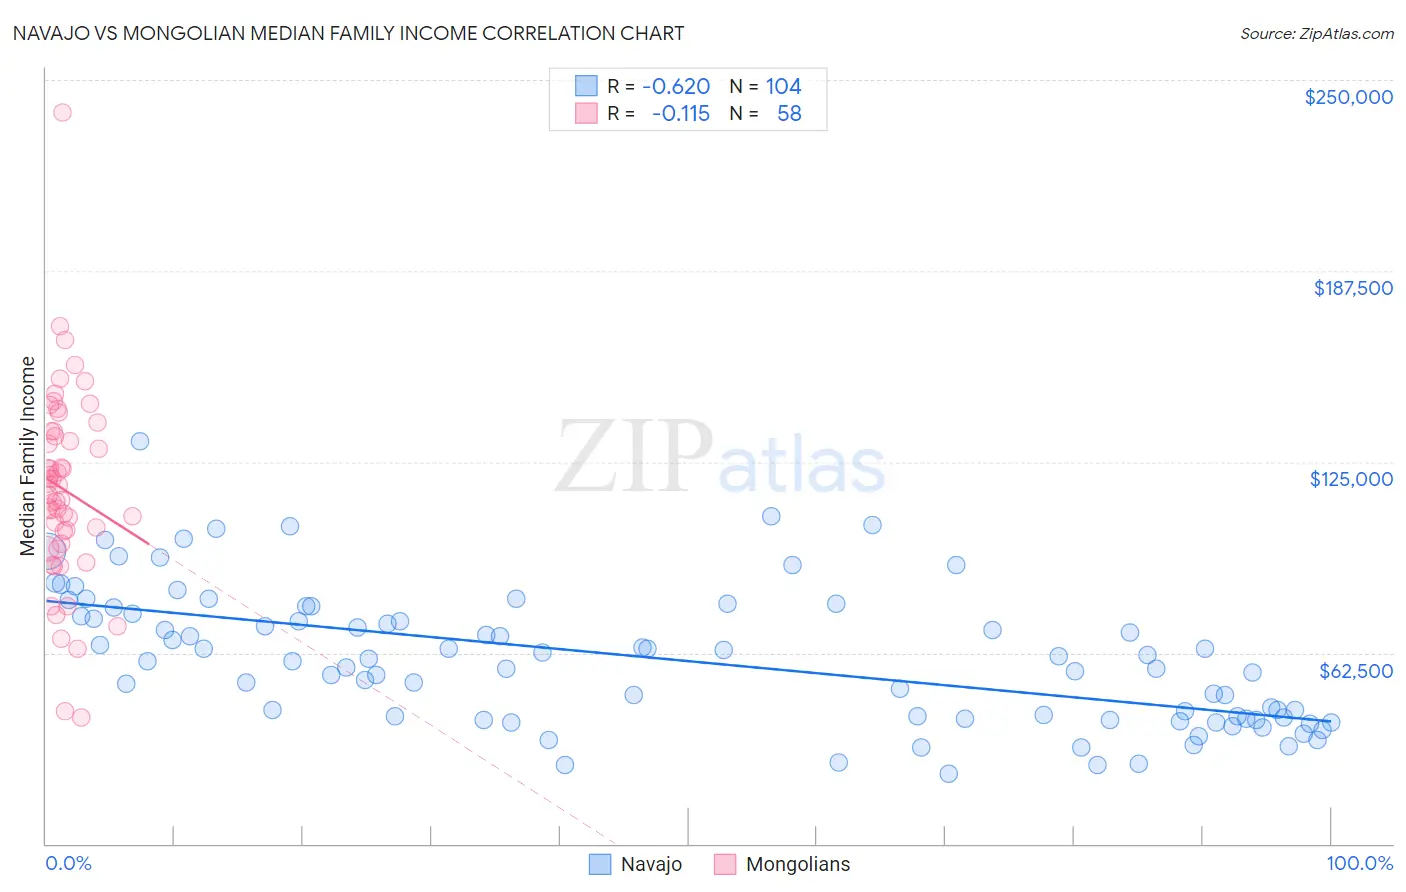
Navajo vs Mongolian Median Family Income Correlation Chart
The statistical analysis conducted on geographies consisting of 224,690,436 people shows a significant negative correlation between the proportion of Navajo and median family income in the United States with a correlation coefficient (R) of -0.620 and weighted average of $70,989. Similarly, the statistical analysis conducted on geographies consisting of 140,257,208 people shows a poor negative correlation between the proportion of Mongolians and median family income in the United States with a correlation coefficient (R) of -0.115 and weighted average of $114,553, a difference of 61.4%.
Median Family Income Correlation Summary
| Measurement | Navajo | Mongolian |
| Minimum | $22,955 | $41,389 |
| Maximum | $131,574 | $239,335 |
| Range | $108,619 | $197,946 |
| Mean | $60,376 | $115,974 |
| Median | $59,766 | $115,745 |
| Interquartile 25% (IQ1) | $41,038 | $98,398 |
| Interquartile 75% (IQ3) | $74,887 | $135,066 |
| Interquartile Range (IQR) | $33,849 | $36,668 |
| Standard Deviation (Sample) | $22,079 | $32,155 |
| Standard Deviation (Population) | $21,972 | $31,876 |
Similar Demographics by Median Family Income
Demographics Similar to Navajo by Median Family Income
In terms of median family income, the demographic groups most similar to Navajo are Puerto Rican ($70,423, a difference of 0.80%), Tohono O'odham ($72,193, a difference of 1.7%), Lumbee ($68,679, a difference of 3.4%), Houma ($76,188, a difference of 7.3%), and Crow ($76,605, a difference of 7.9%).
| Demographics | Rating | Rank | Median Family Income |
| Kiowa | 0.0 /100 | #333 | Tragic $80,885 |
| Menominee | 0.0 /100 | #334 | Tragic $79,563 |
| Yup'ik | 0.0 /100 | #335 | Tragic $79,290 |
| Immigrants | Cuba | 0.0 /100 | #336 | Tragic $78,249 |
| Yuman | 0.0 /100 | #337 | Tragic $78,055 |
| Immigrants | Yemen | 0.0 /100 | #338 | Tragic $77,457 |
| Pima | 0.0 /100 | #339 | Tragic $77,431 |
| Hopi | 0.0 /100 | #340 | Tragic $77,188 |
| Pueblo | 0.0 /100 | #341 | Tragic $76,880 |
| Crow | 0.0 /100 | #342 | Tragic $76,605 |
| Houma | 0.0 /100 | #343 | Tragic $76,188 |
| Tohono O'odham | 0.0 /100 | #344 | Tragic $72,193 |
| Navajo | 0.0 /100 | #345 | Tragic $70,989 |
| Puerto Ricans | 0.0 /100 | #346 | Tragic $70,423 |
| Lumbee | 0.0 /100 | #347 | Tragic $68,679 |
Demographics Similar to Mongolians by Median Family Income
In terms of median family income, the demographic groups most similar to Mongolians are Immigrants from Belarus ($114,586, a difference of 0.030%), Immigrants from Pakistan ($114,406, a difference of 0.13%), Immigrants from Scotland ($114,392, a difference of 0.14%), Immigrants from Latvia ($114,826, a difference of 0.24%), and Immigrants from Netherlands ($114,987, a difference of 0.38%).
| Demographics | Rating | Rank | Median Family Income |
| Lithuanians | 99.8 /100 | #55 | Exceptional $115,395 |
| New Zealanders | 99.8 /100 | #56 | Exceptional $115,230 |
| Greeks | 99.8 /100 | #57 | Exceptional $115,192 |
| Immigrants | Indonesia | 99.8 /100 | #58 | Exceptional $115,162 |
| Immigrants | Netherlands | 99.8 /100 | #59 | Exceptional $114,987 |
| Immigrants | Latvia | 99.8 /100 | #60 | Exceptional $114,826 |
| Immigrants | Belarus | 99.8 /100 | #61 | Exceptional $114,586 |
| Mongolians | 99.8 /100 | #62 | Exceptional $114,553 |
| Immigrants | Pakistan | 99.8 /100 | #63 | Exceptional $114,406 |
| Immigrants | Scotland | 99.7 /100 | #64 | Exceptional $114,392 |
| Egyptians | 99.7 /100 | #65 | Exceptional $114,119 |
| Paraguayans | 99.7 /100 | #66 | Exceptional $114,016 |
| Immigrants | Spain | 99.7 /100 | #67 | Exceptional $113,815 |
| Immigrants | Serbia | 99.6 /100 | #68 | Exceptional $113,463 |
| Immigrants | Bulgaria | 99.6 /100 | #69 | Exceptional $113,461 |