Blackfeet vs Mongolian Median Family Income
COMPARE
Blackfeet
Mongolian
Median Family Income
Median Family Income Comparison
Blackfeet
Mongolians
$88,717
MEDIAN FAMILY INCOME
0.1/ 100
METRIC RATING
281st/ 347
METRIC RANK
$114,553
MEDIAN FAMILY INCOME
99.8/ 100
METRIC RATING
62nd/ 347
METRIC RANK
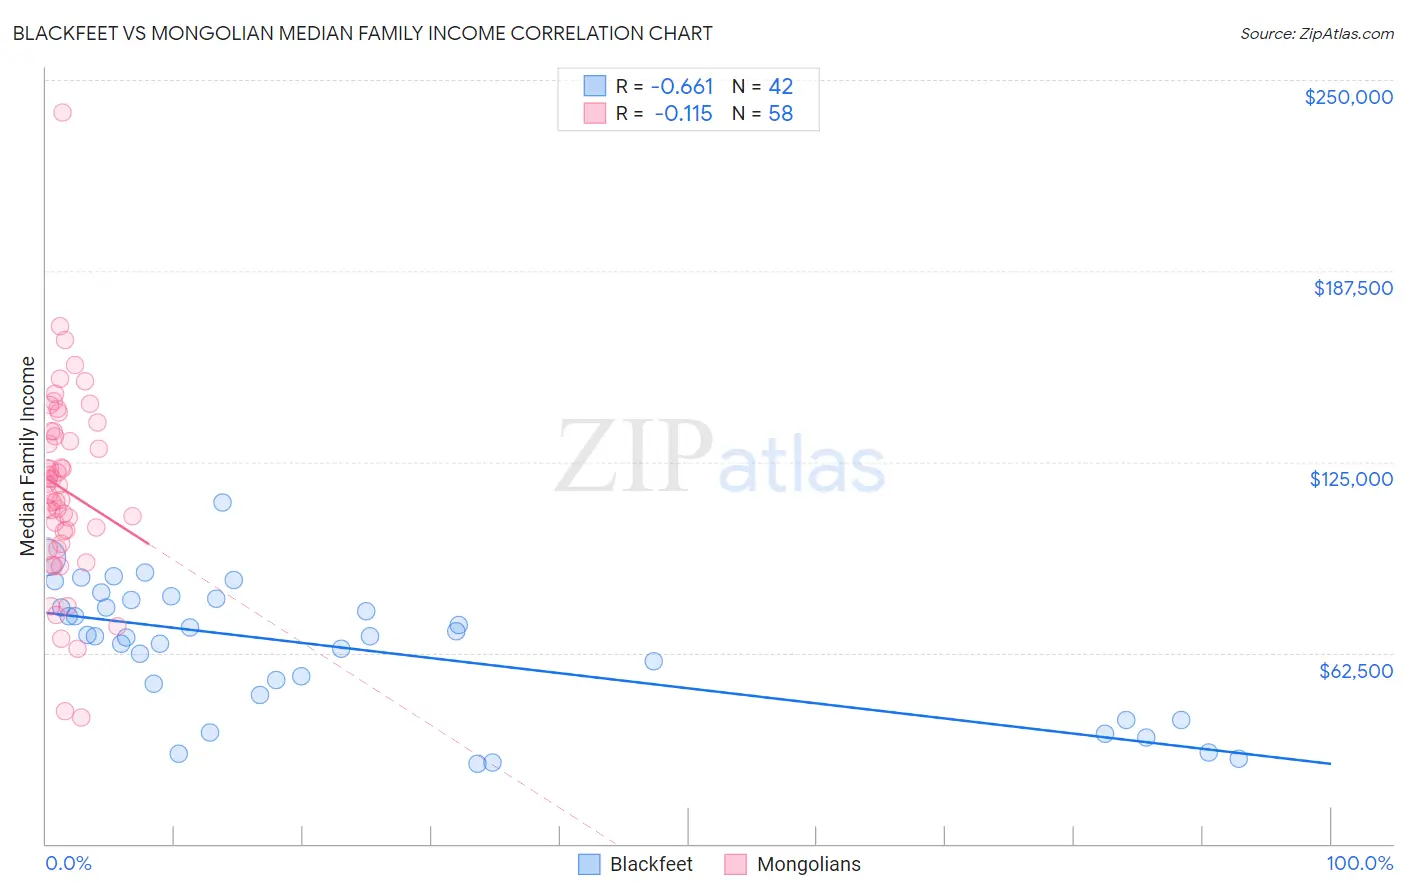
Blackfeet vs Mongolian Median Family Income Correlation Chart
The statistical analysis conducted on geographies consisting of 309,409,082 people shows a significant negative correlation between the proportion of Blackfeet and median family income in the United States with a correlation coefficient (R) of -0.661 and weighted average of $88,717. Similarly, the statistical analysis conducted on geographies consisting of 140,257,208 people shows a poor negative correlation between the proportion of Mongolians and median family income in the United States with a correlation coefficient (R) of -0.115 and weighted average of $114,553, a difference of 29.1%.
Median Family Income Correlation Summary
| Measurement | Blackfeet | Mongolian |
| Minimum | $26,000 | $41,389 |
| Maximum | $111,536 | $239,335 |
| Range | $85,536 | $197,946 |
| Mean | $63,847 | $115,974 |
| Median | $68,073 | $115,745 |
| Interquartile 25% (IQ1) | $48,694 | $98,398 |
| Interquartile 75% (IQ3) | $79,668 | $135,066 |
| Interquartile Range (IQR) | $30,974 | $36,668 |
| Standard Deviation (Sample) | $21,241 | $32,155 |
| Standard Deviation (Population) | $20,987 | $31,876 |
Similar Demographics by Median Family Income
Demographics Similar to Blackfeet by Median Family Income
In terms of median family income, the demographic groups most similar to Blackfeet are Comanche ($88,556, a difference of 0.18%), British West Indian ($88,987, a difference of 0.30%), Bangladeshi ($88,358, a difference of 0.41%), Indonesian ($88,301, a difference of 0.47%), and Guatemalan ($88,295, a difference of 0.48%).
| Demographics | Rating | Rank | Median Family Income |
| Spanish Americans | 0.2 /100 | #274 | Tragic $90,322 |
| Immigrants | St. Vincent and the Grenadines | 0.2 /100 | #275 | Tragic $90,094 |
| Immigrants | Zaire | 0.1 /100 | #276 | Tragic $89,285 |
| Immigrants | Jamaica | 0.1 /100 | #277 | Tragic $89,268 |
| Immigrants | Grenada | 0.1 /100 | #278 | Tragic $89,249 |
| Immigrants | Belize | 0.1 /100 | #279 | Tragic $89,197 |
| British West Indians | 0.1 /100 | #280 | Tragic $88,987 |
| Blackfeet | 0.1 /100 | #281 | Tragic $88,717 |
| Comanche | 0.1 /100 | #282 | Tragic $88,556 |
| Bangladeshis | 0.1 /100 | #283 | Tragic $88,358 |
| Indonesians | 0.1 /100 | #284 | Tragic $88,301 |
| Guatemalans | 0.1 /100 | #285 | Tragic $88,295 |
| Immigrants | Nicaragua | 0.1 /100 | #286 | Tragic $88,267 |
| Potawatomi | 0.1 /100 | #287 | Tragic $88,265 |
| Cherokee | 0.1 /100 | #288 | Tragic $88,209 |
Demographics Similar to Mongolians by Median Family Income
In terms of median family income, the demographic groups most similar to Mongolians are Immigrants from Belarus ($114,586, a difference of 0.030%), Immigrants from Pakistan ($114,406, a difference of 0.13%), Immigrants from Scotland ($114,392, a difference of 0.14%), Immigrants from Latvia ($114,826, a difference of 0.24%), and Immigrants from Netherlands ($114,987, a difference of 0.38%).
| Demographics | Rating | Rank | Median Family Income |
| Lithuanians | 99.8 /100 | #55 | Exceptional $115,395 |
| New Zealanders | 99.8 /100 | #56 | Exceptional $115,230 |
| Greeks | 99.8 /100 | #57 | Exceptional $115,192 |
| Immigrants | Indonesia | 99.8 /100 | #58 | Exceptional $115,162 |
| Immigrants | Netherlands | 99.8 /100 | #59 | Exceptional $114,987 |
| Immigrants | Latvia | 99.8 /100 | #60 | Exceptional $114,826 |
| Immigrants | Belarus | 99.8 /100 | #61 | Exceptional $114,586 |
| Mongolians | 99.8 /100 | #62 | Exceptional $114,553 |
| Immigrants | Pakistan | 99.8 /100 | #63 | Exceptional $114,406 |
| Immigrants | Scotland | 99.7 /100 | #64 | Exceptional $114,392 |
| Egyptians | 99.7 /100 | #65 | Exceptional $114,119 |
| Paraguayans | 99.7 /100 | #66 | Exceptional $114,016 |
| Immigrants | Spain | 99.7 /100 | #67 | Exceptional $113,815 |
| Immigrants | Serbia | 99.6 /100 | #68 | Exceptional $113,463 |
| Immigrants | Bulgaria | 99.6 /100 | #69 | Exceptional $113,461 |