Jamaican vs Mongolian 2 or more Vehicles in Household
COMPARE
Jamaican
Mongolian
2 or more Vehicles in Household
2 or more Vehicles in Household Comparison
Jamaicans
Mongolians
45.8%
2 OR MORE VEHICLES IN HOUSEHOLD
0.0/ 100
METRIC RATING
319th/ 347
METRIC RANK
52.8%
2 OR MORE VEHICLES IN HOUSEHOLD
1.0/ 100
METRIC RATING
250th/ 347
METRIC RANK
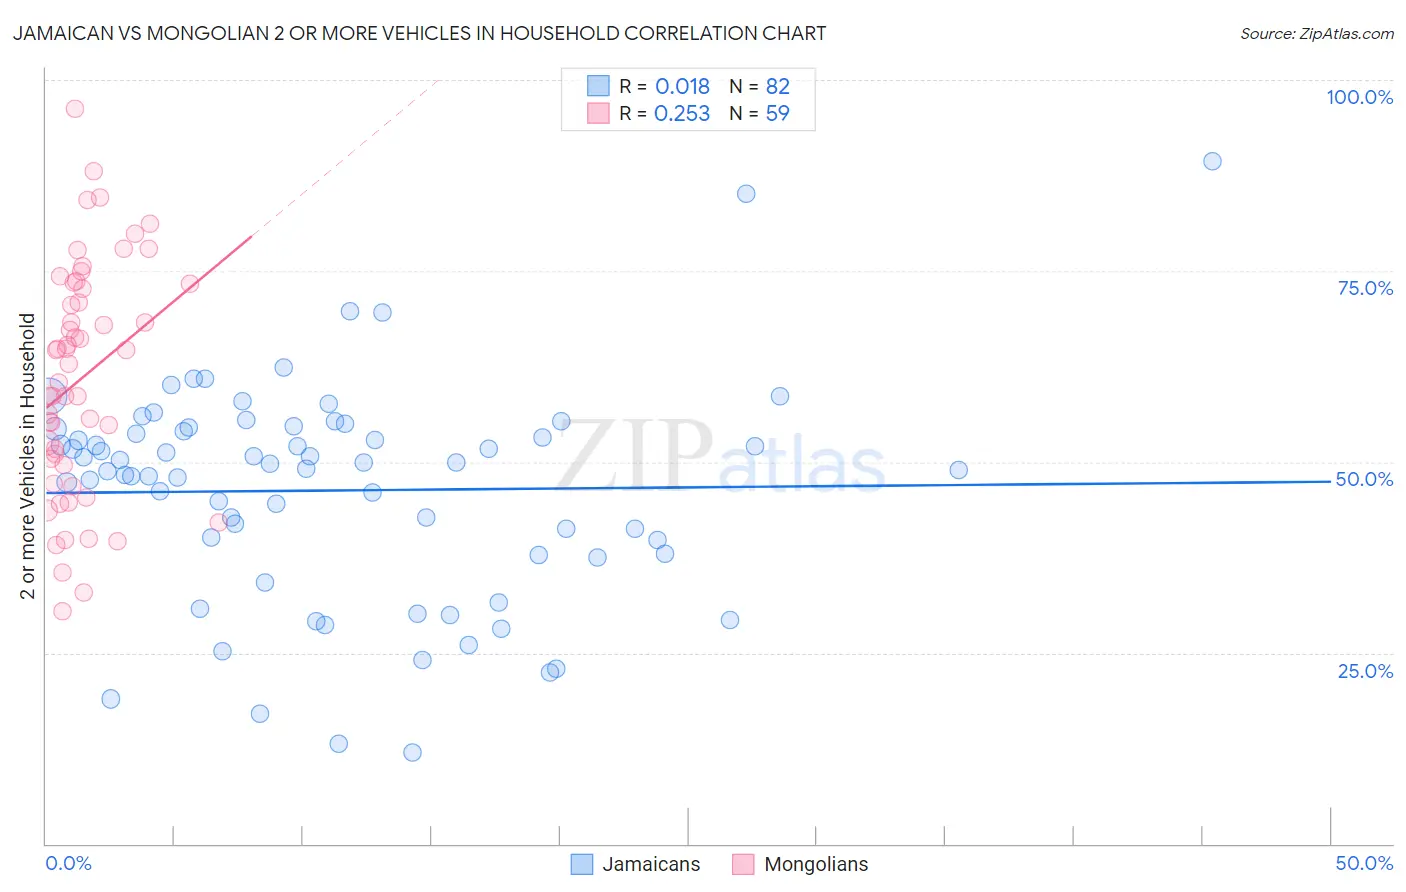
Jamaican vs Mongolian 2 or more Vehicles in Household Correlation Chart
The statistical analysis conducted on geographies consisting of 367,700,586 people shows no correlation between the proportion of Jamaicans and percentage of households with 2 or more vehicles available in the United States with a correlation coefficient (R) of 0.018 and weighted average of 45.8%. Similarly, the statistical analysis conducted on geographies consisting of 140,284,468 people shows a weak positive correlation between the proportion of Mongolians and percentage of households with 2 or more vehicles available in the United States with a correlation coefficient (R) of 0.253 and weighted average of 52.8%, a difference of 15.4%.
2 or more Vehicles in Household Correlation Summary
| Measurement | Jamaican | Mongolian |
| Minimum | 12.0% | 30.5% |
| Maximum | 89.3% | 96.2% |
| Range | 77.3% | 65.7% |
| Mean | 46.3% | 61.0% |
| Median | 49.4% | 62.9% |
| Interquartile 25% (IQ1) | 38.0% | 49.5% |
| Interquartile 75% (IQ3) | 54.3% | 73.3% |
| Interquartile Range (IQR) | 16.3% | 23.7% |
| Standard Deviation (Sample) | 14.2% | 15.0% |
| Standard Deviation (Population) | 14.1% | 14.9% |
Similar Demographics by 2 or more Vehicles in Household
Demographics Similar to Jamaicans by 2 or more Vehicles in Household
In terms of 2 or more vehicles in household, the demographic groups most similar to Jamaicans are Soviet Union (45.7%, a difference of 0.060%), Immigrants from Albania (46.0%, a difference of 0.52%), Immigrants from Haiti (46.5%, a difference of 1.7%), Cape Verdean (46.8%, a difference of 2.2%), and Puerto Rican (47.1%, a difference of 2.9%).
| Demographics | Rating | Rank | 2 or more Vehicles in Household |
| Haitians | 0.0 /100 | #312 | Tragic 47.6% |
| U.S. Virgin Islanders | 0.0 /100 | #313 | Tragic 47.5% |
| Immigrants | Ghana | 0.0 /100 | #314 | Tragic 47.4% |
| Puerto Ricans | 0.0 /100 | #315 | Tragic 47.1% |
| Cape Verdeans | 0.0 /100 | #316 | Tragic 46.8% |
| Immigrants | Haiti | 0.0 /100 | #317 | Tragic 46.5% |
| Immigrants | Albania | 0.0 /100 | #318 | Tragic 46.0% |
| Jamaicans | 0.0 /100 | #319 | Tragic 45.8% |
| Soviet Union | 0.0 /100 | #320 | Tragic 45.7% |
| Immigrants | Jamaica | 0.0 /100 | #321 | Tragic 44.5% |
| Senegalese | 0.0 /100 | #322 | Tragic 44.2% |
| Immigrants | Caribbean | 0.0 /100 | #323 | Tragic 44.2% |
| Immigrants | Cabo Verde | 0.0 /100 | #324 | Tragic 43.3% |
| Immigrants | West Indies | 0.0 /100 | #325 | Tragic 43.1% |
| Immigrants | Senegal | 0.0 /100 | #326 | Tragic 43.0% |
Demographics Similar to Mongolians by 2 or more Vehicles in Household
In terms of 2 or more vehicles in household, the demographic groups most similar to Mongolians are Immigrants from Brazil (52.8%, a difference of 0.0%), Immigrants from Sudan (52.8%, a difference of 0.030%), Immigrants from Portugal (52.8%, a difference of 0.050%), Colombian (52.9%, a difference of 0.060%), and Nigerian (52.8%, a difference of 0.10%).
| Demographics | Rating | Rank | 2 or more Vehicles in Household |
| Ethiopians | 1.7 /100 | #243 | Tragic 53.1% |
| Indians (Asian) | 1.7 /100 | #244 | Tragic 53.1% |
| Immigrants | Ethiopia | 1.5 /100 | #245 | Tragic 53.0% |
| Immigrants | Nigeria | 1.2 /100 | #246 | Tragic 52.9% |
| Sierra Leoneans | 1.2 /100 | #247 | Tragic 52.9% |
| Colombians | 1.1 /100 | #248 | Tragic 52.9% |
| Immigrants | Brazil | 1.0 /100 | #249 | Tragic 52.8% |
| Mongolians | 1.0 /100 | #250 | Tragic 52.8% |
| Immigrants | Sudan | 1.0 /100 | #251 | Tragic 52.8% |
| Immigrants | Portugal | 1.0 /100 | #252 | Tragic 52.8% |
| Nigerians | 0.9 /100 | #253 | Tragic 52.8% |
| Immigrants | Malaysia | 0.8 /100 | #254 | Tragic 52.7% |
| Uruguayans | 0.7 /100 | #255 | Tragic 52.7% |
| Immigrants | Eritrea | 0.7 /100 | #256 | Tragic 52.6% |
| Immigrants | Hong Kong | 0.6 /100 | #257 | Tragic 52.6% |