Immigrants from Chile vs Canadian Median Family Income
COMPARE
Immigrants from Chile
Canadian
Median Family Income
Median Family Income Comparison
Immigrants from Chile
Canadians
$105,655
MEDIAN FAMILY INCOME
82.1/ 100
METRIC RATING
147th/ 347
METRIC RANK
$106,597
MEDIAN FAMILY INCOME
88.1/ 100
METRIC RATING
131st/ 347
METRIC RANK
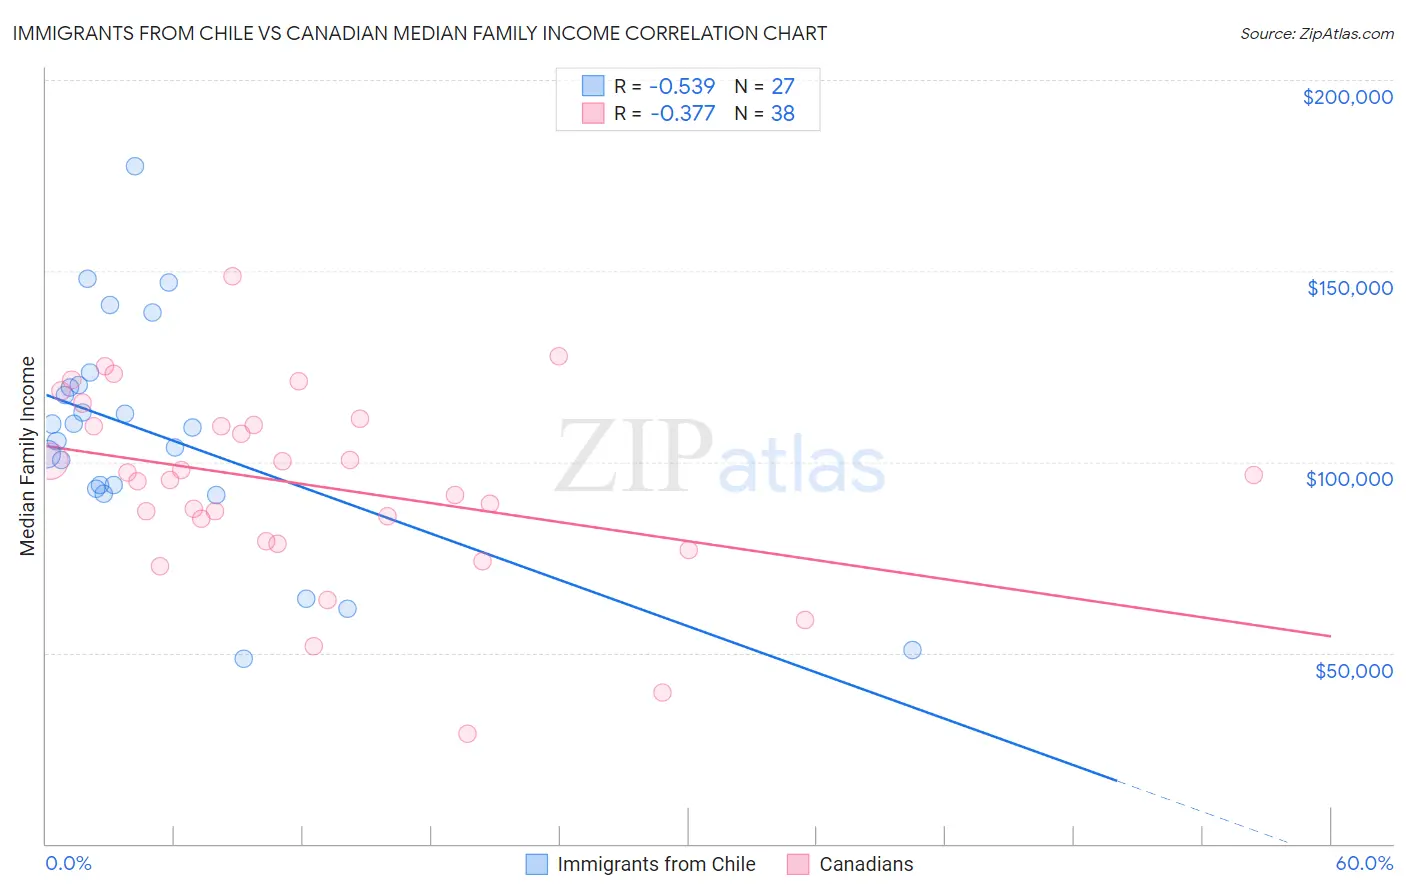
Immigrants from Chile vs Canadian Median Family Income Correlation Chart
The statistical analysis conducted on geographies consisting of 218,577,241 people shows a substantial negative correlation between the proportion of Immigrants from Chile and median family income in the United States with a correlation coefficient (R) of -0.539 and weighted average of $105,655. Similarly, the statistical analysis conducted on geographies consisting of 437,117,064 people shows a mild negative correlation between the proportion of Canadians and median family income in the United States with a correlation coefficient (R) of -0.377 and weighted average of $106,597, a difference of 0.89%.
Median Family Income Correlation Summary
| Measurement | Immigrants from Chile | Canadian |
| Minimum | $48,403 | $28,715 |
| Maximum | $177,440 | $148,748 |
| Range | $129,037 | $120,033 |
| Mean | $106,979 | $93,902 |
| Median | $109,000 | $95,805 |
| Interquartile 25% (IQ1) | $92,919 | $79,333 |
| Interquartile 75% (IQ3) | $120,092 | $109,797 |
| Interquartile Range (IQR) | $27,173 | $30,464 |
| Standard Deviation (Sample) | $29,634 | $24,866 |
| Standard Deviation (Population) | $29,080 | $24,537 |
Demographics Similar to Immigrants from Chile and Canadians by Median Family Income
In terms of median family income, the demographic groups most similar to Immigrants from Chile are Hungarian ($105,609, a difference of 0.040%), Immigrants from Germany ($105,507, a difference of 0.14%), Czech ($105,839, a difference of 0.17%), Danish ($105,900, a difference of 0.23%), and Immigrants from Morocco ($105,964, a difference of 0.29%). Similarly, the demographic groups most similar to Canadians are Immigrants from Fiji ($106,544, a difference of 0.050%), Ugandan ($106,541, a difference of 0.050%), Immigrants from Oceania ($106,453, a difference of 0.14%), Portuguese ($106,286, a difference of 0.29%), and Brazilian ($106,942, a difference of 0.32%).
| Demographics | Rating | Rank | Median Family Income |
| Arabs | 89.9 /100 | #129 | Excellent $106,952 |
| Brazilians | 89.8 /100 | #130 | Excellent $106,942 |
| Canadians | 88.1 /100 | #131 | Excellent $106,597 |
| Immigrants | Fiji | 87.8 /100 | #132 | Excellent $106,544 |
| Ugandans | 87.8 /100 | #133 | Excellent $106,541 |
| Immigrants | Oceania | 87.3 /100 | #134 | Excellent $106,453 |
| Portuguese | 86.3 /100 | #135 | Excellent $106,286 |
| Immigrants | South Eastern Asia | 86.1 /100 | #136 | Excellent $106,252 |
| Immigrants | Uganda | 85.7 /100 | #137 | Excellent $106,188 |
| Immigrants | Vietnam | 85.7 /100 | #138 | Excellent $106,186 |
| Luxembourgers | 85.7 /100 | #139 | Excellent $106,183 |
| Norwegians | 85.5 /100 | #140 | Excellent $106,144 |
| Immigrants | Syria | 85.3 /100 | #141 | Excellent $106,118 |
| Slovenes | 84.7 /100 | #142 | Excellent $106,020 |
| Tongans | 84.3 /100 | #143 | Excellent $105,967 |
| Immigrants | Morocco | 84.3 /100 | #144 | Excellent $105,964 |
| Danes | 83.8 /100 | #145 | Excellent $105,900 |
| Czechs | 83.4 /100 | #146 | Excellent $105,839 |
| Immigrants | Chile | 82.1 /100 | #147 | Excellent $105,655 |
| Hungarians | 81.7 /100 | #148 | Excellent $105,609 |
| Immigrants | Germany | 80.9 /100 | #149 | Excellent $105,507 |