Nigerian vs Canadian Median Family Income
COMPARE
Nigerian
Canadian
Median Family Income
Median Family Income Comparison
Nigerians
Canadians
$97,522
MEDIAN FAMILY INCOME
6.7/ 100
METRIC RATING
215th/ 347
METRIC RANK
$106,597
MEDIAN FAMILY INCOME
88.1/ 100
METRIC RATING
131st/ 347
METRIC RANK
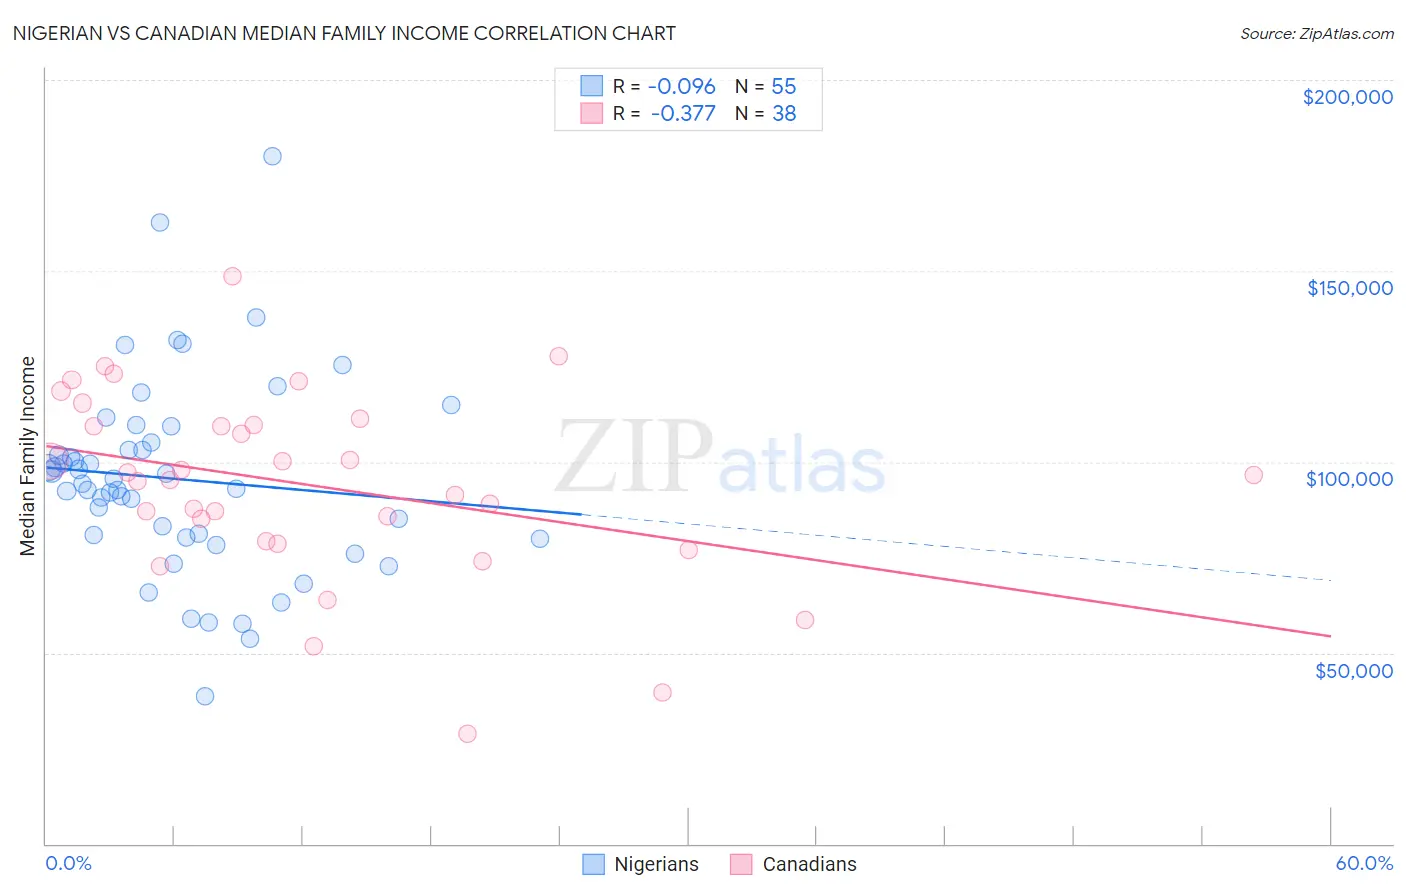
Nigerian vs Canadian Median Family Income Correlation Chart
The statistical analysis conducted on geographies consisting of 332,335,879 people shows a slight negative correlation between the proportion of Nigerians and median family income in the United States with a correlation coefficient (R) of -0.096 and weighted average of $97,522. Similarly, the statistical analysis conducted on geographies consisting of 437,117,064 people shows a mild negative correlation between the proportion of Canadians and median family income in the United States with a correlation coefficient (R) of -0.377 and weighted average of $106,597, a difference of 9.3%.
Median Family Income Correlation Summary
| Measurement | Nigerian | Canadian |
| Minimum | $38,750 | $28,715 |
| Maximum | $179,905 | $148,748 |
| Range | $141,155 | $120,033 |
| Mean | $95,484 | $93,902 |
| Median | $94,247 | $95,805 |
| Interquartile 25% (IQ1) | $80,166 | $79,333 |
| Interquartile 75% (IQ3) | $105,230 | $109,797 |
| Interquartile Range (IQR) | $25,063 | $30,464 |
| Standard Deviation (Sample) | $25,645 | $24,866 |
| Standard Deviation (Population) | $25,411 | $24,537 |
Similar Demographics by Median Family Income
Demographics Similar to Nigerians by Median Family Income
In terms of median family income, the demographic groups most similar to Nigerians are Bermudan ($97,577, a difference of 0.060%), Immigrants from Armenia ($97,605, a difference of 0.090%), Immigrants from Bosnia and Herzegovina ($97,432, a difference of 0.090%), Panamanian ($97,683, a difference of 0.17%), and Immigrants from Sudan ($97,737, a difference of 0.22%).
| Demographics | Rating | Rank | Median Family Income |
| Immigrants | Uruguay | 9.2 /100 | #208 | Tragic $98,205 |
| Immigrants | Colombia | 8.7 /100 | #209 | Tragic $98,067 |
| Puget Sound Salish | 8.2 /100 | #210 | Tragic $97,958 |
| Immigrants | Sudan | 7.4 /100 | #211 | Tragic $97,737 |
| Panamanians | 7.2 /100 | #212 | Tragic $97,683 |
| Immigrants | Armenia | 7.0 /100 | #213 | Tragic $97,605 |
| Bermudans | 6.9 /100 | #214 | Tragic $97,577 |
| Nigerians | 6.7 /100 | #215 | Tragic $97,522 |
| Immigrants | Bosnia and Herzegovina | 6.4 /100 | #216 | Tragic $97,432 |
| Japanese | 6.0 /100 | #217 | Tragic $97,288 |
| Immigrants | Cambodia | 5.8 /100 | #218 | Tragic $97,222 |
| Delaware | 5.1 /100 | #219 | Tragic $96,958 |
| Sudanese | 4.7 /100 | #220 | Tragic $96,783 |
| Immigrants | Ghana | 4.2 /100 | #221 | Tragic $96,544 |
| Immigrants | Nigeria | 4.0 /100 | #222 | Tragic $96,439 |
Demographics Similar to Canadians by Median Family Income
In terms of median family income, the demographic groups most similar to Canadians are Immigrants from Fiji ($106,544, a difference of 0.050%), Ugandan ($106,541, a difference of 0.050%), Immigrants from Oceania ($106,453, a difference of 0.14%), Portuguese ($106,286, a difference of 0.29%), and Brazilian ($106,942, a difference of 0.32%).
| Demographics | Rating | Rank | Median Family Income |
| Pakistanis | 91.7 /100 | #124 | Exceptional $107,390 |
| Taiwanese | 91.4 /100 | #125 | Exceptional $107,295 |
| Serbians | 90.8 /100 | #126 | Exceptional $107,157 |
| Lebanese | 90.5 /100 | #127 | Exceptional $107,086 |
| Immigrants | Ethiopia | 90.0 /100 | #128 | Excellent $106,969 |
| Arabs | 89.9 /100 | #129 | Excellent $106,952 |
| Brazilians | 89.8 /100 | #130 | Excellent $106,942 |
| Canadians | 88.1 /100 | #131 | Excellent $106,597 |
| Immigrants | Fiji | 87.8 /100 | #132 | Excellent $106,544 |
| Ugandans | 87.8 /100 | #133 | Excellent $106,541 |
| Immigrants | Oceania | 87.3 /100 | #134 | Excellent $106,453 |
| Portuguese | 86.3 /100 | #135 | Excellent $106,286 |
| Immigrants | South Eastern Asia | 86.1 /100 | #136 | Excellent $106,252 |
| Immigrants | Uganda | 85.7 /100 | #137 | Excellent $106,188 |
| Immigrants | Vietnam | 85.7 /100 | #138 | Excellent $106,186 |