Immigrants from Poland vs Canadian Median Family Income
COMPARE
Immigrants from Poland
Canadian
Median Family Income
Median Family Income Comparison
Immigrants from Poland
Canadians
$108,570
MEDIAN FAMILY INCOME
95.3/ 100
METRIC RATING
112th/ 347
METRIC RANK
$106,597
MEDIAN FAMILY INCOME
88.1/ 100
METRIC RATING
131st/ 347
METRIC RANK
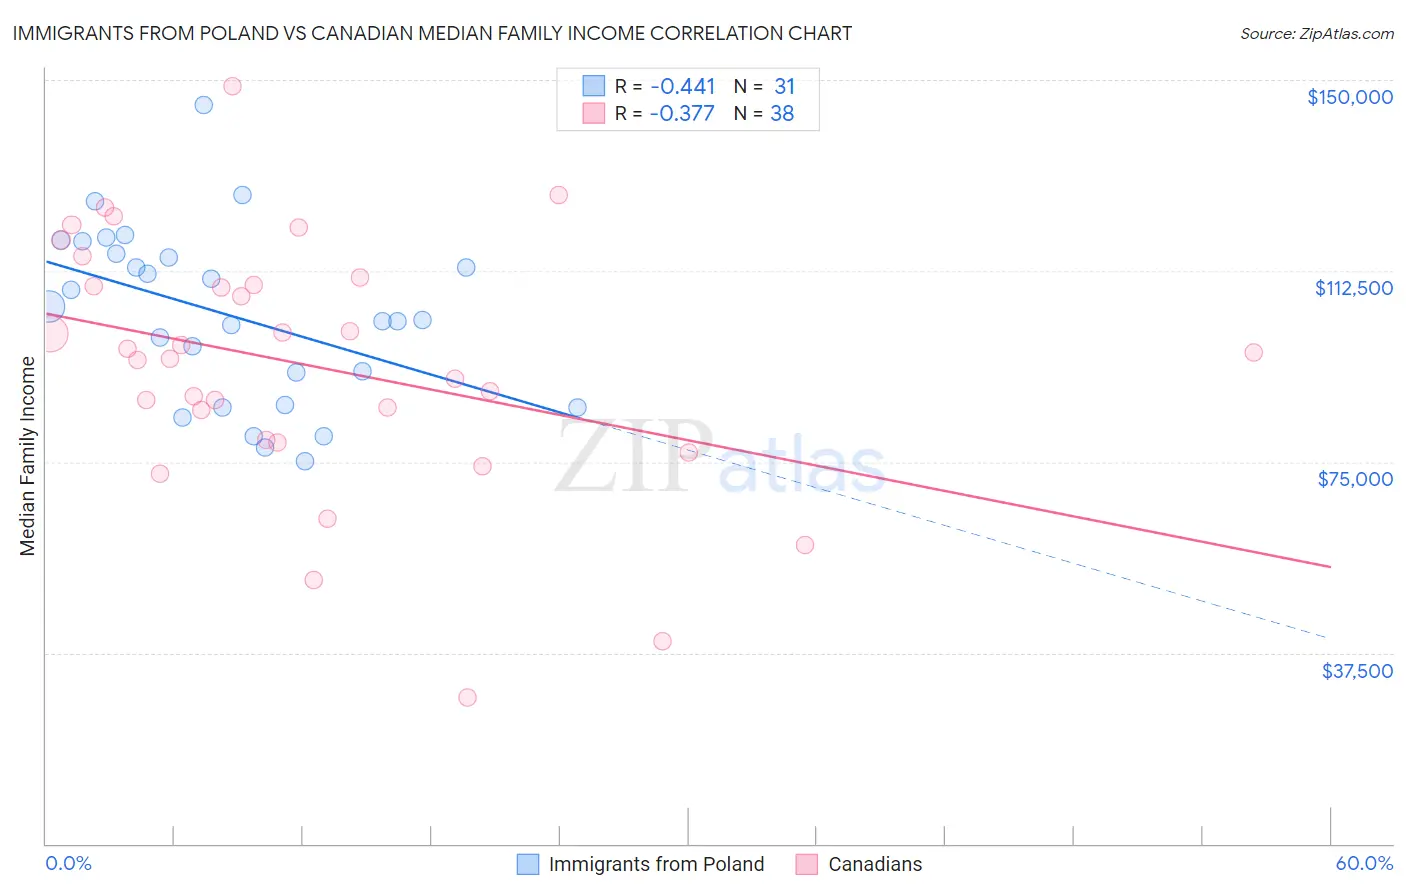
Immigrants from Poland vs Canadian Median Family Income Correlation Chart
The statistical analysis conducted on geographies consisting of 304,741,932 people shows a moderate negative correlation between the proportion of Immigrants from Poland and median family income in the United States with a correlation coefficient (R) of -0.441 and weighted average of $108,570. Similarly, the statistical analysis conducted on geographies consisting of 437,117,064 people shows a mild negative correlation between the proportion of Canadians and median family income in the United States with a correlation coefficient (R) of -0.377 and weighted average of $106,597, a difference of 1.8%.
Median Family Income Correlation Summary
| Measurement | Immigrants from Poland | Canadian |
| Minimum | $75,129 | $28,715 |
| Maximum | $144,968 | $148,748 |
| Range | $69,839 | $120,033 |
| Mean | $103,726 | $93,902 |
| Median | $102,831 | $95,805 |
| Interquartile 25% (IQ1) | $86,137 | $79,333 |
| Interquartile 75% (IQ3) | $115,861 | $109,797 |
| Interquartile Range (IQR) | $29,724 | $30,464 |
| Standard Deviation (Sample) | $16,903 | $24,866 |
| Standard Deviation (Population) | $16,628 | $24,537 |
Demographics Similar to Immigrants from Poland and Canadians by Median Family Income
In terms of median family income, the demographic groups most similar to Immigrants from Poland are Immigrants from Saudi Arabia ($108,544, a difference of 0.020%), Polish ($108,507, a difference of 0.060%), Swedish ($108,499, a difference of 0.070%), Immigrants from Western Asia ($108,691, a difference of 0.11%), and Chilean ($108,429, a difference of 0.13%). Similarly, the demographic groups most similar to Canadians are Brazilian ($106,942, a difference of 0.32%), Arab ($106,952, a difference of 0.33%), Immigrants from Ethiopia ($106,969, a difference of 0.35%), Lebanese ($107,086, a difference of 0.46%), and Serbian ($107,157, a difference of 0.53%).
| Demographics | Rating | Rank | Median Family Income |
| Immigrants | Western Asia | 95.6 /100 | #111 | Exceptional $108,691 |
| Immigrants | Poland | 95.3 /100 | #112 | Exceptional $108,570 |
| Immigrants | Saudi Arabia | 95.2 /100 | #113 | Exceptional $108,544 |
| Poles | 95.2 /100 | #114 | Exceptional $108,507 |
| Swedes | 95.1 /100 | #115 | Exceptional $108,499 |
| Chileans | 95.0 /100 | #116 | Exceptional $108,429 |
| Immigrants | Philippines | 94.6 /100 | #117 | Exceptional $108,288 |
| Ethiopians | 94.5 /100 | #118 | Exceptional $108,251 |
| Sri Lankans | 94.5 /100 | #119 | Exceptional $108,234 |
| Immigrants | Northern Africa | 94.3 /100 | #120 | Exceptional $108,161 |
| Europeans | 94.1 /100 | #121 | Exceptional $108,099 |
| Immigrants | Jordan | 92.9 /100 | #122 | Exceptional $107,715 |
| Carpatho Rusyns | 92.2 /100 | #123 | Exceptional $107,502 |
| Pakistanis | 91.7 /100 | #124 | Exceptional $107,390 |
| Taiwanese | 91.4 /100 | #125 | Exceptional $107,295 |
| Serbians | 90.8 /100 | #126 | Exceptional $107,157 |
| Lebanese | 90.5 /100 | #127 | Exceptional $107,086 |
| Immigrants | Ethiopia | 90.0 /100 | #128 | Excellent $106,969 |
| Arabs | 89.9 /100 | #129 | Excellent $106,952 |
| Brazilians | 89.8 /100 | #130 | Excellent $106,942 |
| Canadians | 88.1 /100 | #131 | Excellent $106,597 |