Jamaican vs Canadian Unemployment Among Women with Children Ages 6 to 17 years
COMPARE
Jamaican
Canadian
Unemployment Among Women with Children Ages 6 to 17 years
Unemployment Among Women with Children Ages 6 to 17 years Comparison
Jamaicans
Canadians
9.8%
UNEMPLOYMENT AMONG WOMEN WITH CHILDREN AGES 6 TO 17 YEARS
0.0/ 100
METRIC RATING
281st/ 347
METRIC RANK
9.4%
UNEMPLOYMENT AMONG WOMEN WITH CHILDREN AGES 6 TO 17 YEARS
0.8/ 100
METRIC RATING
256th/ 347
METRIC RANK
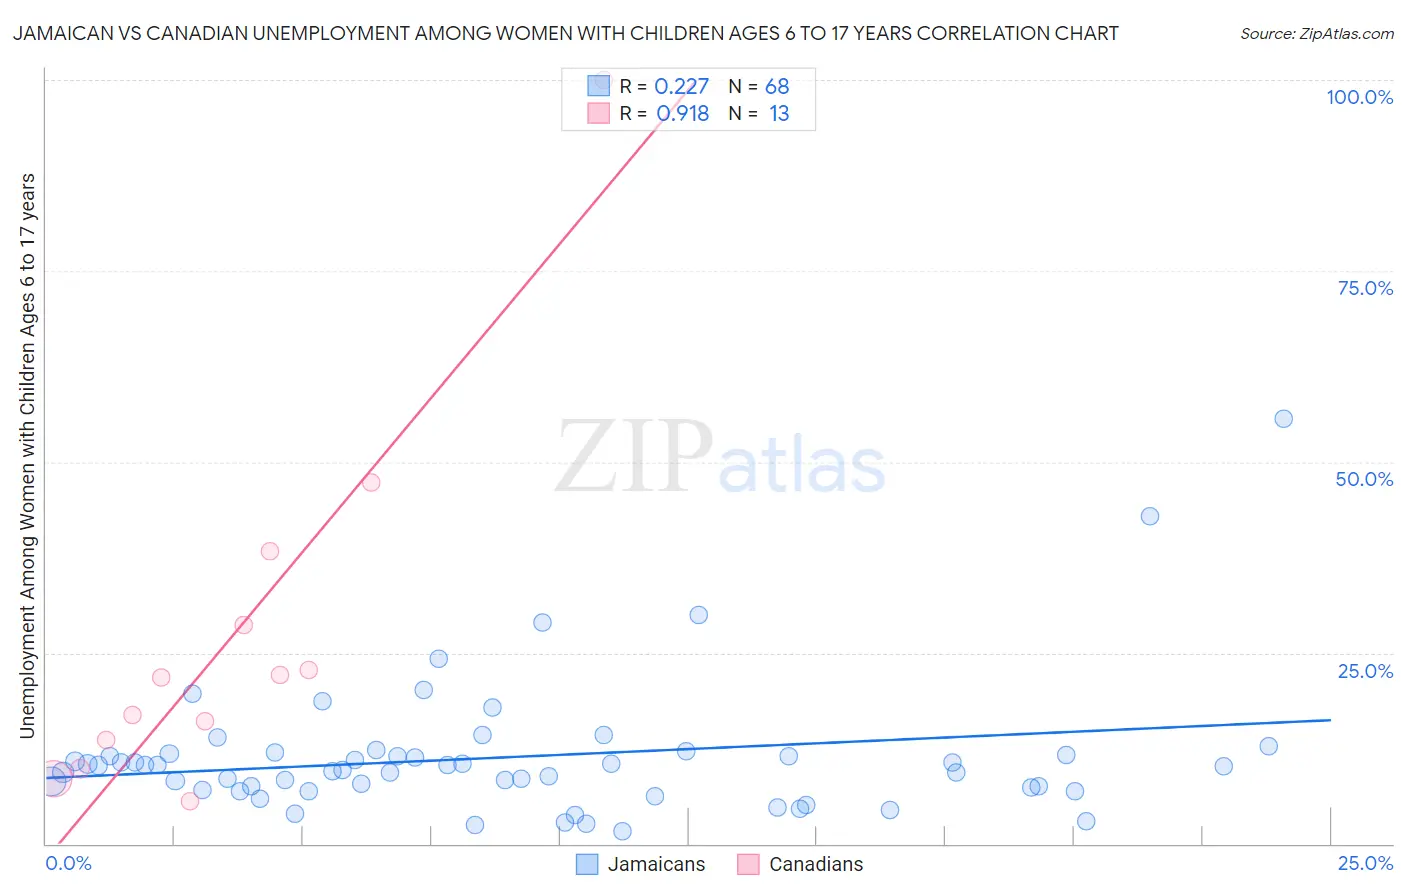
Jamaican vs Canadian Unemployment Among Women with Children Ages 6 to 17 years Correlation Chart
The statistical analysis conducted on geographies consisting of 272,557,643 people shows a weak positive correlation between the proportion of Jamaicans and unemployment rate among women with children between the ages 6 and 17 in the United States with a correlation coefficient (R) of 0.227 and weighted average of 9.8%. Similarly, the statistical analysis conducted on geographies consisting of 299,880,127 people shows a near-perfect positive correlation between the proportion of Canadians and unemployment rate among women with children between the ages 6 and 17 in the United States with a correlation coefficient (R) of 0.918 and weighted average of 9.4%, a difference of 3.4%.
Unemployment Among Women with Children Ages 6 to 17 years Correlation Summary
| Measurement | Jamaican | Canadian |
| Minimum | 1.6% | 5.6% |
| Maximum | 55.7% | 100.0% |
| Range | 54.1% | 94.4% |
| Mean | 11.3% | 27.0% |
| Median | 10.2% | 21.8% |
| Interquartile 25% (IQ1) | 7.2% | 11.7% |
| Interquartile 75% (IQ3) | 11.8% | 33.5% |
| Interquartile Range (IQR) | 4.6% | 21.8% |
| Standard Deviation (Sample) | 8.6% | 24.9% |
| Standard Deviation (Population) | 8.6% | 23.9% |
Similar Demographics by Unemployment Among Women with Children Ages 6 to 17 years
Demographics Similar to Jamaicans by Unemployment Among Women with Children Ages 6 to 17 years
In terms of unemployment among women with children ages 6 to 17 years, the demographic groups most similar to Jamaicans are Slovak (9.8%, a difference of 0.23%), Seminole (9.7%, a difference of 0.53%), Scotch-Irish (9.7%, a difference of 0.72%), French (9.7%, a difference of 0.75%), and British West Indian (9.7%, a difference of 0.82%).
| Demographics | Rating | Rank | Unemployment Among Women with Children Ages 6 to 17 years |
| Aleuts | 0.1 /100 | #274 | Tragic 9.6% |
| U.S. Virgin Islanders | 0.1 /100 | #275 | Tragic 9.7% |
| Immigrants | Portugal | 0.1 /100 | #276 | Tragic 9.7% |
| British West Indians | 0.1 /100 | #277 | Tragic 9.7% |
| French | 0.1 /100 | #278 | Tragic 9.7% |
| Scotch-Irish | 0.1 /100 | #279 | Tragic 9.7% |
| Seminole | 0.1 /100 | #280 | Tragic 9.7% |
| Jamaicans | 0.0 /100 | #281 | Tragic 9.8% |
| Slovaks | 0.0 /100 | #282 | Tragic 9.8% |
| Central American Indians | 0.0 /100 | #283 | Tragic 9.9% |
| Yakama | 0.0 /100 | #284 | Tragic 9.9% |
| Hispanics or Latinos | 0.0 /100 | #285 | Tragic 9.9% |
| Choctaw | 0.0 /100 | #286 | Tragic 9.9% |
| Sierra Leoneans | 0.0 /100 | #287 | Tragic 9.9% |
| Shoshone | 0.0 /100 | #288 | Tragic 10.0% |
Demographics Similar to Canadians by Unemployment Among Women with Children Ages 6 to 17 years
In terms of unemployment among women with children ages 6 to 17 years, the demographic groups most similar to Canadians are Celtic (9.5%, a difference of 0.020%), Immigrants from Mexico (9.5%, a difference of 0.11%), Lithuanian (9.4%, a difference of 0.17%), Immigrants from Central America (9.5%, a difference of 0.20%), and Nicaraguan (9.4%, a difference of 0.23%).
| Demographics | Rating | Rank | Unemployment Among Women with Children Ages 6 to 17 years |
| Immigrants | South America | 1.5 /100 | #249 | Tragic 9.4% |
| Immigrants | Guatemala | 1.3 /100 | #250 | Tragic 9.4% |
| Central Americans | 1.3 /100 | #251 | Tragic 9.4% |
| Creek | 1.2 /100 | #252 | Tragic 9.4% |
| Portuguese | 1.1 /100 | #253 | Tragic 9.4% |
| Nicaraguans | 1.0 /100 | #254 | Tragic 9.4% |
| Lithuanians | 0.9 /100 | #255 | Tragic 9.4% |
| Canadians | 0.8 /100 | #256 | Tragic 9.4% |
| Celtics | 0.7 /100 | #257 | Tragic 9.5% |
| Immigrants | Mexico | 0.7 /100 | #258 | Tragic 9.5% |
| Immigrants | Central America | 0.6 /100 | #259 | Tragic 9.5% |
| Italians | 0.6 /100 | #260 | Tragic 9.5% |
| South Americans | 0.5 /100 | #261 | Tragic 9.5% |
| Senegalese | 0.5 /100 | #262 | Tragic 9.5% |
| Lebanese | 0.5 /100 | #263 | Tragic 9.5% |