Jamaican vs Canadian Single Mother Households
COMPARE
Jamaican
Canadian
Single Mother Households
Single Mother Households Comparison
Jamaicans
Canadians
8.2%
SINGLE MOTHER HOUSEHOLDS
0.0/ 100
METRIC RATING
319th/ 347
METRIC RANK
5.9%
SINGLE MOTHER HOUSEHOLDS
90.5/ 100
METRIC RATING
134th/ 347
METRIC RANK
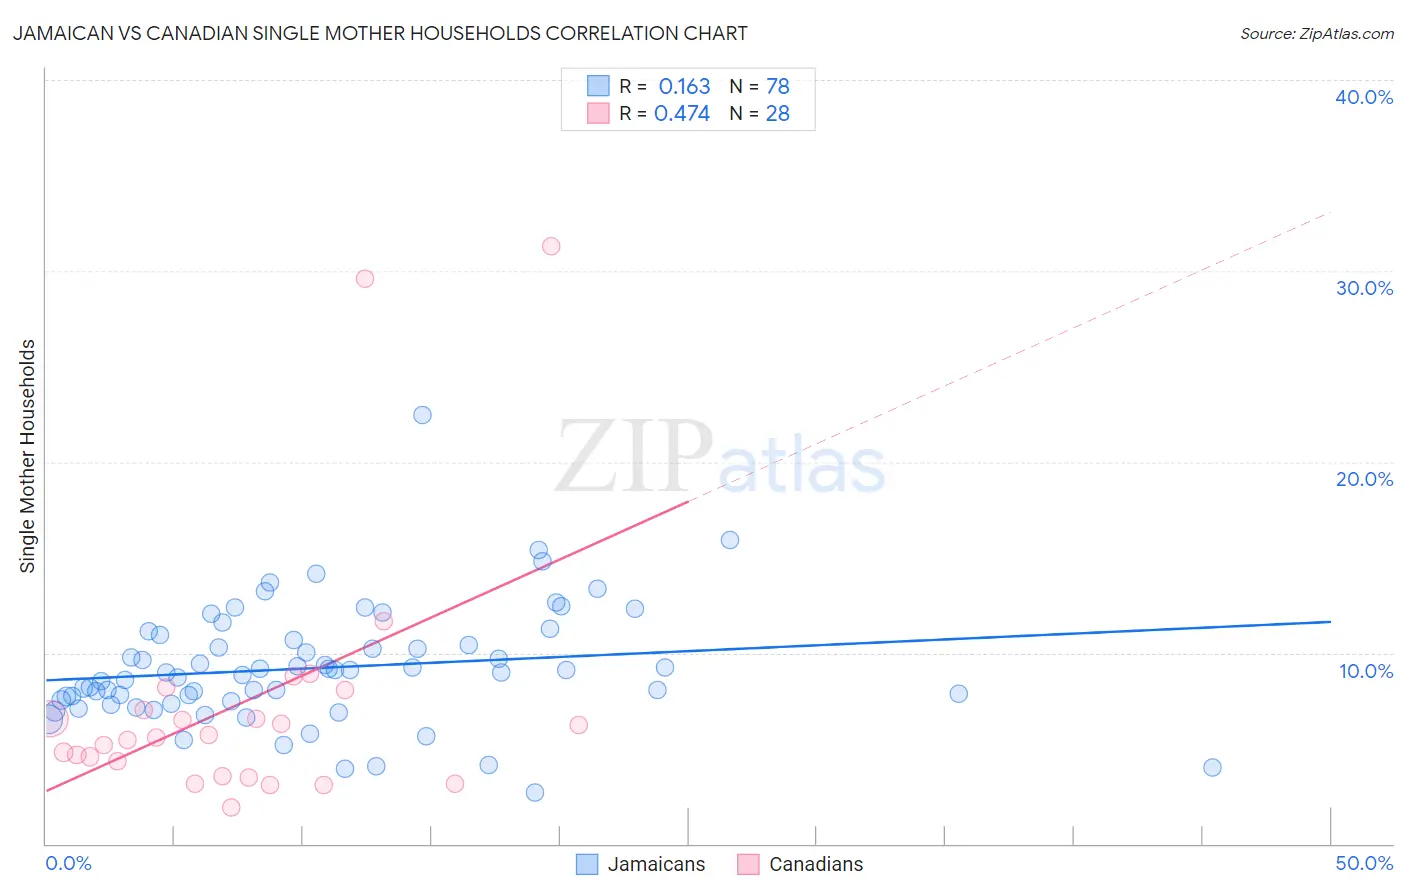
Jamaican vs Canadian Single Mother Households Correlation Chart
The statistical analysis conducted on geographies consisting of 367,100,383 people shows a poor positive correlation between the proportion of Jamaicans and percentage of single mother households in the United States with a correlation coefficient (R) of 0.163 and weighted average of 8.2%. Similarly, the statistical analysis conducted on geographies consisting of 435,747,557 people shows a moderate positive correlation between the proportion of Canadians and percentage of single mother households in the United States with a correlation coefficient (R) of 0.474 and weighted average of 5.9%, a difference of 39.2%.
Single Mother Households Correlation Summary
| Measurement | Jamaican | Canadian |
| Minimum | 2.7% | 1.9% |
| Maximum | 22.5% | 31.3% |
| Range | 19.8% | 29.4% |
| Mean | 9.2% | 7.4% |
| Median | 9.0% | 5.7% |
| Interquartile 25% (IQ1) | 7.4% | 3.9% |
| Interquartile 75% (IQ3) | 10.7% | 7.6% |
| Interquartile Range (IQR) | 3.2% | 3.6% |
| Standard Deviation (Sample) | 3.1% | 6.9% |
| Standard Deviation (Population) | 3.1% | 6.7% |
Similar Demographics by Single Mother Households
Demographics Similar to Jamaicans by Single Mother Households
In terms of single mother households, the demographic groups most similar to Jamaicans are Senegalese (8.2%, a difference of 0.11%), Bahamian (8.3%, a difference of 0.12%), Immigrants from Senegal (8.3%, a difference of 0.36%), Pima (8.3%, a difference of 0.44%), and Immigrants from Honduras (8.2%, a difference of 0.68%).
| Demographics | Rating | Rank | Single Mother Households |
| Bangladeshis | 0.0 /100 | #312 | Tragic 8.1% |
| Immigrants | Grenada | 0.0 /100 | #313 | Tragic 8.2% |
| Immigrants | Mexico | 0.0 /100 | #314 | Tragic 8.2% |
| Immigrants | Western Africa | 0.0 /100 | #315 | Tragic 8.2% |
| Africans | 0.0 /100 | #316 | Tragic 8.2% |
| Immigrants | Honduras | 0.0 /100 | #317 | Tragic 8.2% |
| Senegalese | 0.0 /100 | #318 | Tragic 8.2% |
| Jamaicans | 0.0 /100 | #319 | Tragic 8.2% |
| Bahamians | 0.0 /100 | #320 | Tragic 8.3% |
| Immigrants | Senegal | 0.0 /100 | #321 | Tragic 8.3% |
| Pima | 0.0 /100 | #322 | Tragic 8.3% |
| Haitians | 0.0 /100 | #323 | Tragic 8.3% |
| Immigrants | Jamaica | 0.0 /100 | #324 | Tragic 8.4% |
| Immigrants | Caribbean | 0.0 /100 | #325 | Tragic 8.4% |
| British West Indians | 0.0 /100 | #326 | Tragic 8.4% |
Demographics Similar to Canadians by Single Mother Households
In terms of single mother households, the demographic groups most similar to Canadians are Egyptian (5.9%, a difference of 0.060%), Immigrants from Saudi Arabia (5.9%, a difference of 0.090%), Albanian (5.9%, a difference of 0.22%), Immigrants from Spain (5.9%, a difference of 0.26%), and Jordanian (6.0%, a difference of 0.51%).
| Demographics | Rating | Rank | Single Mother Households |
| Lebanese | 92.4 /100 | #127 | Exceptional 5.9% |
| Czechoslovakians | 92.2 /100 | #128 | Exceptional 5.9% |
| Immigrants | Bolivia | 92.2 /100 | #129 | Exceptional 5.9% |
| Palestinians | 92.1 /100 | #130 | Exceptional 5.9% |
| Immigrants | Spain | 91.2 /100 | #131 | Exceptional 5.9% |
| Albanians | 91.1 /100 | #132 | Exceptional 5.9% |
| Egyptians | 90.7 /100 | #133 | Exceptional 5.9% |
| Canadians | 90.5 /100 | #134 | Exceptional 5.9% |
| Immigrants | Saudi Arabia | 90.2 /100 | #135 | Exceptional 5.9% |
| Jordanians | 88.9 /100 | #136 | Excellent 6.0% |
| Immigrants | Pakistan | 88.4 /100 | #137 | Excellent 6.0% |
| Icelanders | 86.9 /100 | #138 | Excellent 6.0% |
| Syrians | 86.0 /100 | #139 | Excellent 6.0% |
| French | 85.7 /100 | #140 | Excellent 6.0% |
| Tsimshian | 85.2 /100 | #141 | Excellent 6.0% |