Apache vs Serbian Median Earnings
COMPARE
Apache
Serbian
Median Earnings
Median Earnings Comparison
Apache
Serbians
$40,388
MEDIAN EARNINGS
0.0/ 100
METRIC RATING
310th/ 347
METRIC RANK
$48,677
MEDIAN EARNINGS
95.9/ 100
METRIC RATING
117th/ 347
METRIC RANK
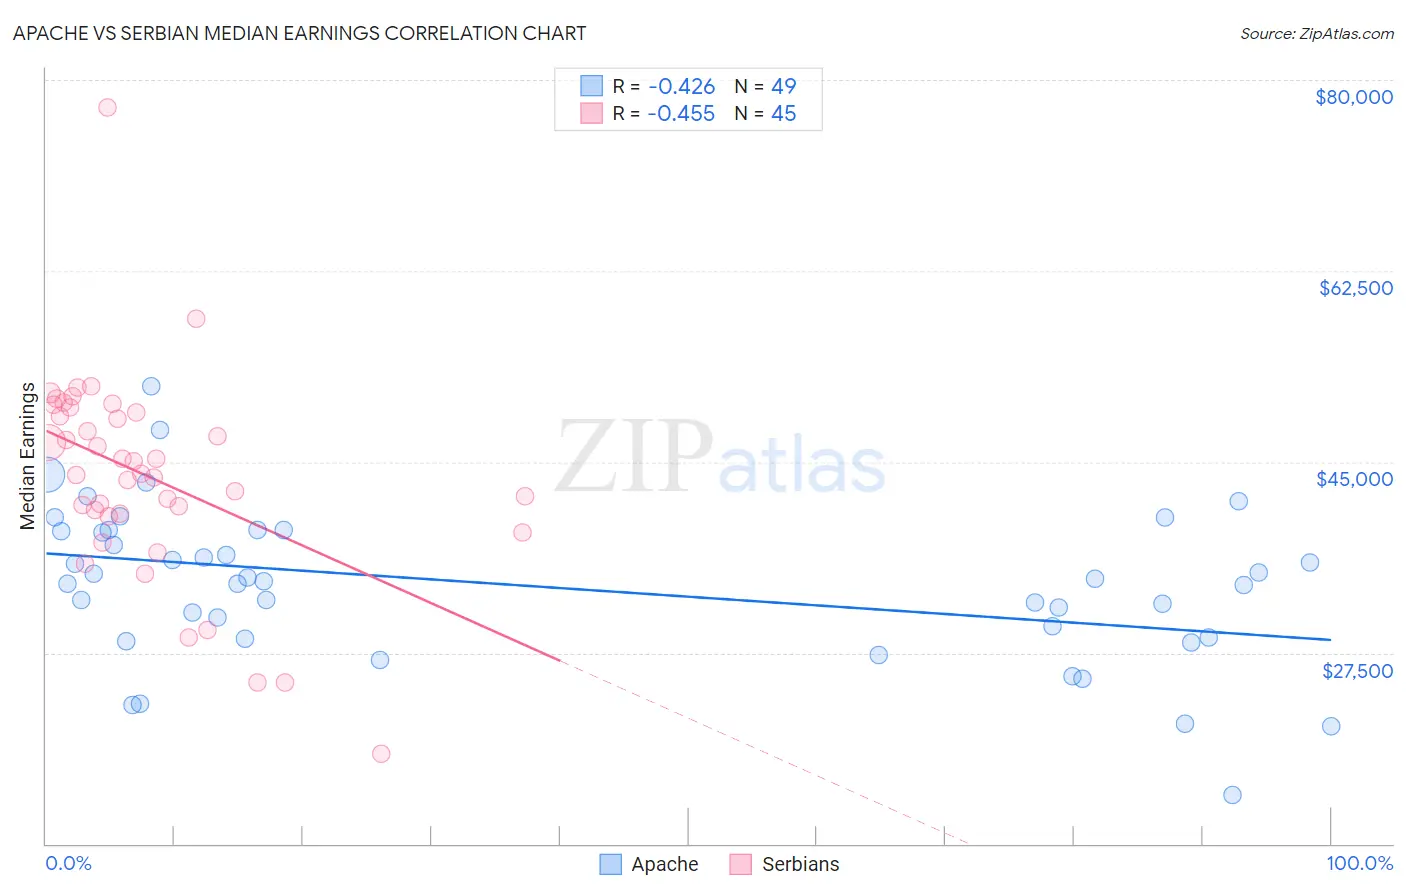
Apache vs Serbian Median Earnings Correlation Chart
The statistical analysis conducted on geographies consisting of 231,119,863 people shows a moderate negative correlation between the proportion of Apache and median earnings in the United States with a correlation coefficient (R) of -0.426 and weighted average of $40,388. Similarly, the statistical analysis conducted on geographies consisting of 267,654,810 people shows a moderate negative correlation between the proportion of Serbians and median earnings in the United States with a correlation coefficient (R) of -0.455 and weighted average of $48,677, a difference of 20.5%.
Median Earnings Correlation Summary
| Measurement | Apache | Serbian |
| Minimum | $14,458 | $18,250 |
| Maximum | $51,892 | $77,452 |
| Range | $37,433 | $59,202 |
| Mean | $33,634 | $43,689 |
| Median | $34,056 | $43,879 |
| Interquartile 25% (IQ1) | $28,886 | $40,125 |
| Interquartile 75% (IQ3) | $38,705 | $49,731 |
| Interquartile Range (IQR) | $9,819 | $9,606 |
| Standard Deviation (Sample) | $7,141 | $9,625 |
| Standard Deviation (Population) | $7,068 | $9,517 |
Similar Demographics by Median Earnings
Demographics Similar to Apache by Median Earnings
In terms of median earnings, the demographic groups most similar to Apache are Hispanic or Latino ($40,288, a difference of 0.25%), Chippewa ($40,287, a difference of 0.25%), Choctaw ($40,270, a difference of 0.29%), Cheyenne ($40,233, a difference of 0.39%), and Seminole ($40,233, a difference of 0.39%).
| Demographics | Rating | Rank | Median Earnings |
| Haitians | 0.0 /100 | #303 | Tragic $40,918 |
| Immigrants | Guatemala | 0.0 /100 | #304 | Tragic $40,851 |
| Chickasaw | 0.0 /100 | #305 | Tragic $40,672 |
| Yaqui | 0.0 /100 | #306 | Tragic $40,647 |
| Hondurans | 0.0 /100 | #307 | Tragic $40,638 |
| Cubans | 0.0 /100 | #308 | Tragic $40,619 |
| Immigrants | Haiti | 0.0 /100 | #309 | Tragic $40,550 |
| Apache | 0.0 /100 | #310 | Tragic $40,388 |
| Hispanics or Latinos | 0.0 /100 | #311 | Tragic $40,288 |
| Chippewa | 0.0 /100 | #312 | Tragic $40,287 |
| Choctaw | 0.0 /100 | #313 | Tragic $40,270 |
| Cheyenne | 0.0 /100 | #314 | Tragic $40,233 |
| Seminole | 0.0 /100 | #315 | Tragic $40,233 |
| Immigrants | Honduras | 0.0 /100 | #316 | Tragic $40,195 |
| Fijians | 0.0 /100 | #317 | Tragic $40,193 |
Demographics Similar to Serbians by Median Earnings
In terms of median earnings, the demographic groups most similar to Serbians are Immigrants from Jordan ($48,673, a difference of 0.010%), Polish ($48,659, a difference of 0.040%), Korean ($48,727, a difference of 0.10%), Carpatho Rusyn ($48,617, a difference of 0.12%), and Arab ($48,599, a difference of 0.16%).
| Demographics | Rating | Rank | Median Earnings |
| Immigrants | Ethiopia | 97.1 /100 | #110 | Exceptional $48,924 |
| Immigrants | Zimbabwe | 97.0 /100 | #111 | Exceptional $48,913 |
| Northern Europeans | 96.9 /100 | #112 | Exceptional $48,887 |
| Immigrants | Kuwait | 96.8 /100 | #113 | Exceptional $48,861 |
| Moroccans | 96.7 /100 | #114 | Exceptional $48,838 |
| Chinese | 96.7 /100 | #115 | Exceptional $48,836 |
| Koreans | 96.2 /100 | #116 | Exceptional $48,727 |
| Serbians | 95.9 /100 | #117 | Exceptional $48,677 |
| Immigrants | Jordan | 95.9 /100 | #118 | Exceptional $48,673 |
| Poles | 95.8 /100 | #119 | Exceptional $48,659 |
| Carpatho Rusyns | 95.5 /100 | #120 | Exceptional $48,617 |
| Arabs | 95.4 /100 | #121 | Exceptional $48,599 |
| Chileans | 94.8 /100 | #122 | Exceptional $48,504 |
| Immigrants | Syria | 93.9 /100 | #123 | Exceptional $48,375 |
| Brazilians | 93.7 /100 | #124 | Exceptional $48,356 |